Live · Every Sunday · Free · No Sign-Up
The FreeLive Class.Every Sunday.
About an hour on a shared screen, reading real charts out loud, starting from zero: what a candle and the volume bar underneath it are actually telling you. The point is that you leave reading something you could not read when you arrived.
Next class
Every Sunday 22:00 UTC
Every Sunday at 22:00 UTC. Your own local time shows here once the page has loaded.
The join link goes up about 15 minutes before the start. This button switches on by itself when it does. It is also posted in the Telegram channel.
01 Try It Now
Two candles. Which side had it easier?
This is how every class starts. No indicator and no jargon: only how far each bar closed, and the volume it took to get there. Take a guess.
Your read
Which bar shows the buyers having an easier time?
Show the answer
Bar A. Both bars closed up the same distance, but A did it on a third of the volume B needed. Same result, a third of the effort: there was little selling in A’s way. B’s buyers had to push through three times the volume to travel the same distance, which says sellers were meeting them all the way up.
That single comparison, the distance closed against the volume it took, is where every class begins. The hour then applies it bar by bar to real charts.
02 The Recordings
See the room before you walk in.
Seven past classes are published as they were taught, unrehearsed, and every cut is disclosed on the class’s own page. None of them was recorded to be shown. Ten minutes of any of them will tell you whether the room is for you.
Reading the tape, before anything else. The class every student here starts with. Unscripted, strong language, transcript on the class page.
How the published classes run
- The measurement firstTwo candles on a clean chart: how far each one closed, and the volume it took.
- Then real chartsPast charts, on purpose, read out loud from the monthly down to the one-minute while Charles draws.
- Then your turnStudents narrate the next bars out loud and get corrected when the number or the direction is wrong.
- Questions from the roomThe end of the hour is open questions, yours included.
- Unrehearsed
- You will be asked
- Blunt language
- Recorded, shared only with permission
The class is taught the way a language is learned. Not from a list of rules, but by sitting in the room while it is spoken, week after week, until it starts to read itself.
“This is now my first language… Just immerse yourself and then it will get there. It’s not an easy process, but it does work.”
Charles Vincent, in a past class
Six more classes, unedited
Live Group Class · 1:13:39 · Newest
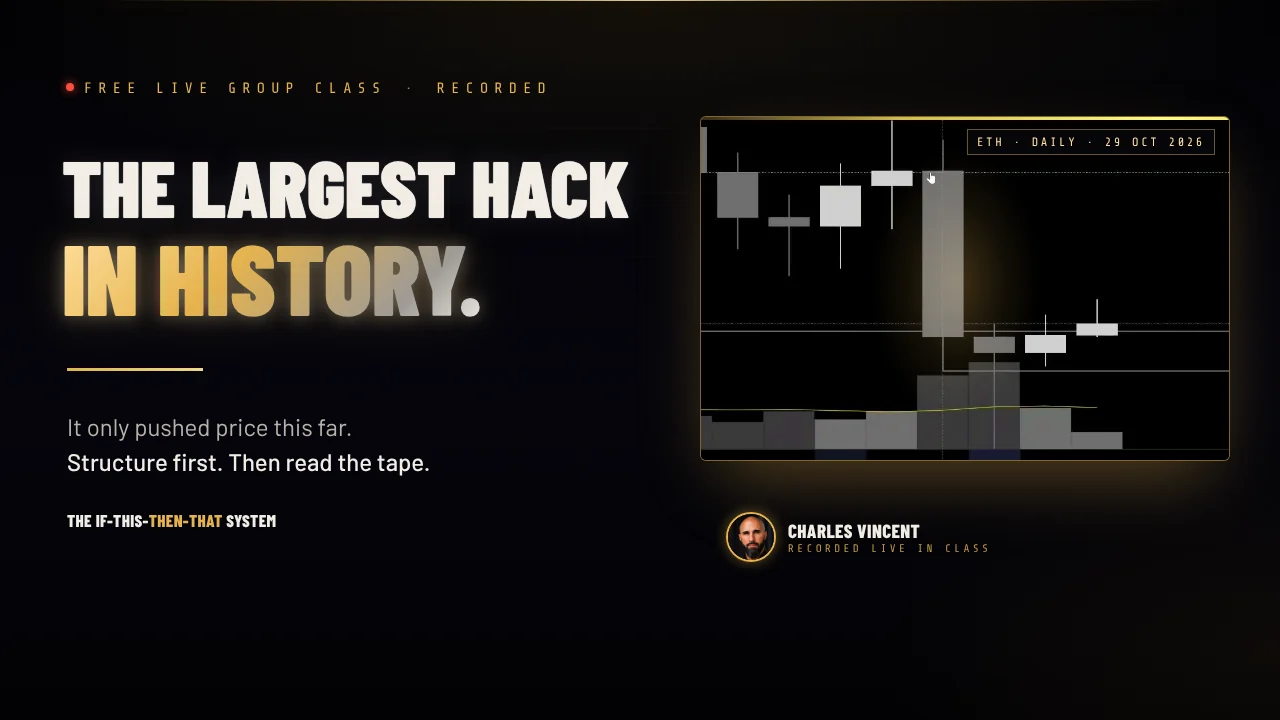
How to play the largest hack in history.
Taught a few days after the Binance hack, reported as the largest crypto theft on record. Structure first, then the tape: the levels that matter, the record-volume bar that stopped on monthly support, and a past range that unpacked the same way. Then the questions that matter: what invalidates it, what to wait for, and how to enter with a clear stop and a sensible size.
Watch the class and read the transcriptLive Group Class · 1:19:46
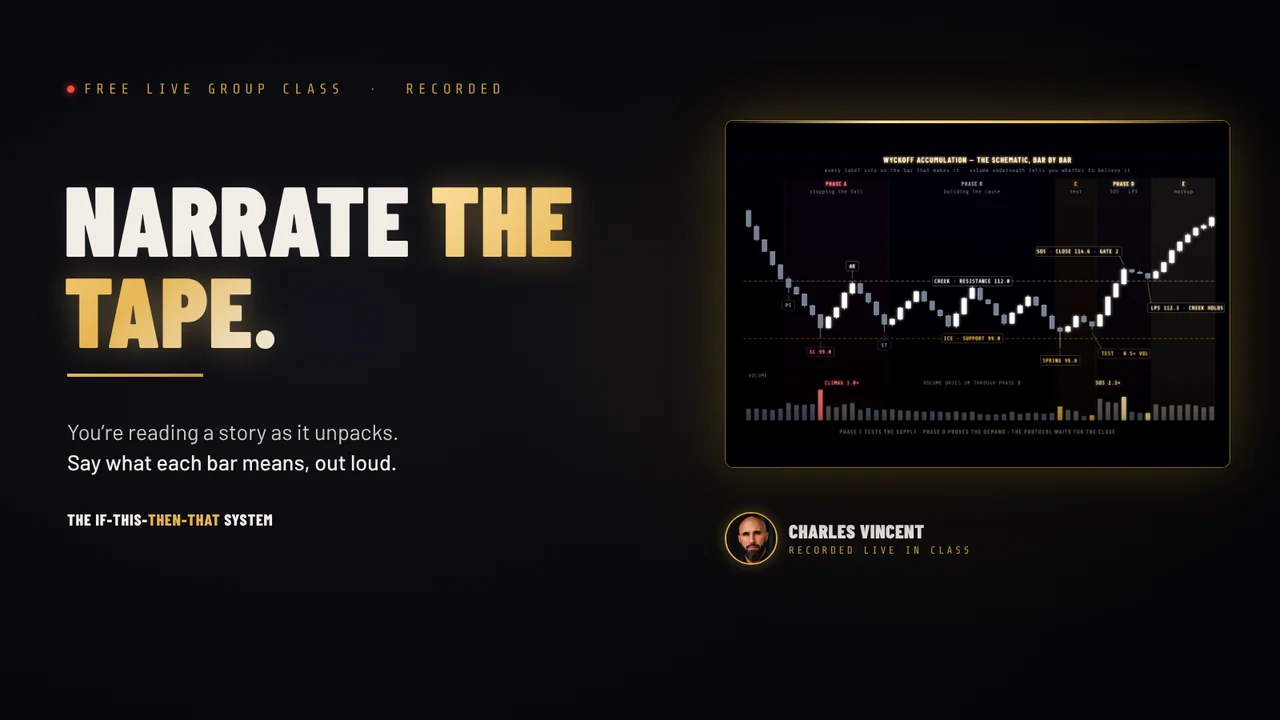
Narrate the tape. One bar, then the next.
Reading the tape is narration: hold each bar against the last and say what just happened. Charles reads ETH’s April 2025 low bar by bar, then the students narrate the range that followed, out loud, naming the control bars, the sweeps and the stopping power, and get corrected when the number or the direction is wrong. It ends by counting the whole move.
Watch the class and read the transcriptLive Group Class · 1:15:27
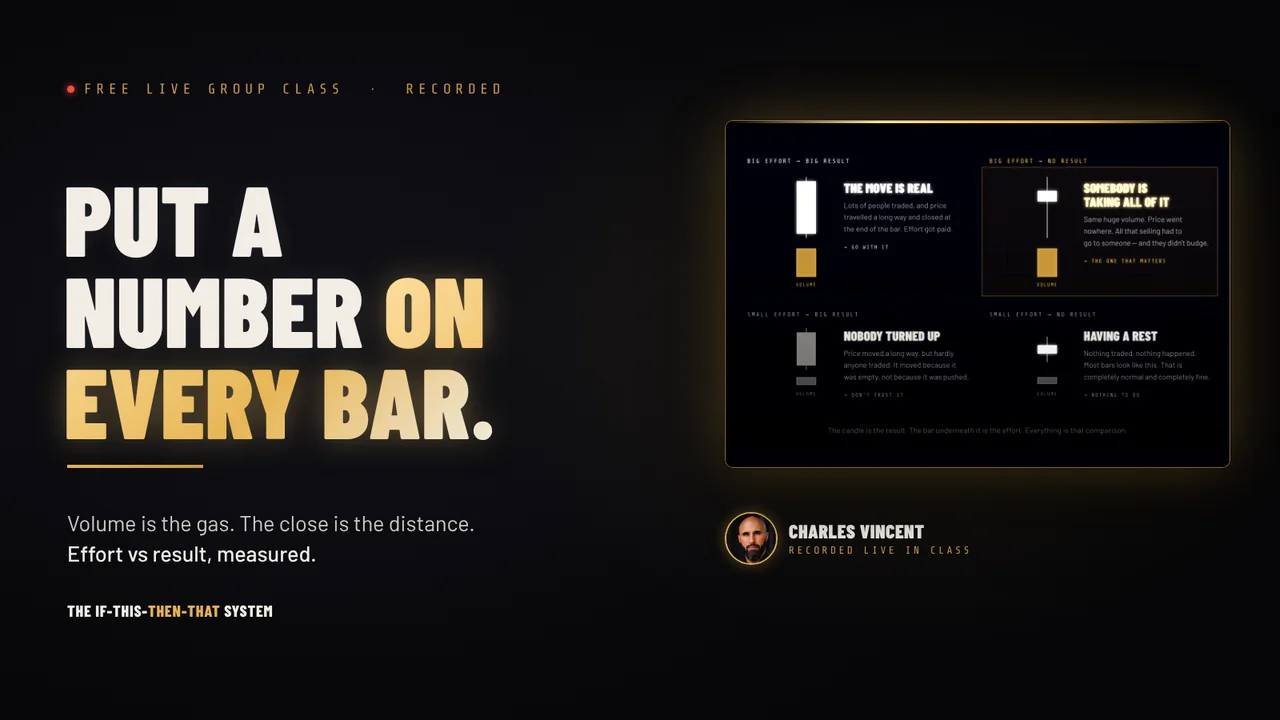
Put a number on every bar. Effort against result.
Volume is the gas and the close is the distance. Weigh one bar against the last and you can put a rough number on how much easier one side has become, before price says so. Charles works it on ETH down into a selling climax and counts the move out of the low; then the students read the April 2025 crash bar by bar, out loud, and get corrected when the number or the direction is wrong.
Watch the class and read the transcriptLive Group Class · 1:35:47
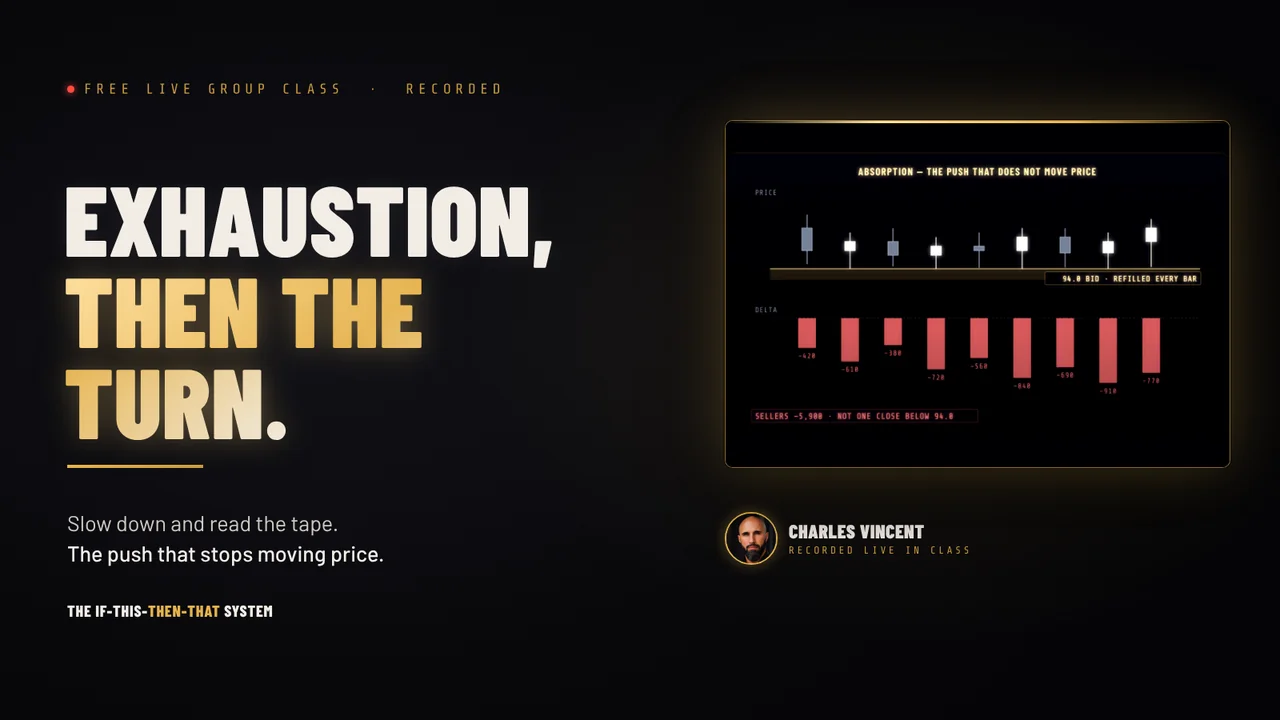
Exhaustion, then the turn. Read bar by bar.
Why price can rise on almost no volume once the sellers are gone, and how to tell that from a crowd of buyers at a round number. Then the students read a 12-hour downtrend from the far-left candle, one bar against the last, and get corrected out loud, including on calling a long inside a downtrend. It ends on the selling climax braking to a halt and the first bar that says the turn has come.
Watch the class and read the transcriptLive Group Class · 1:03:01
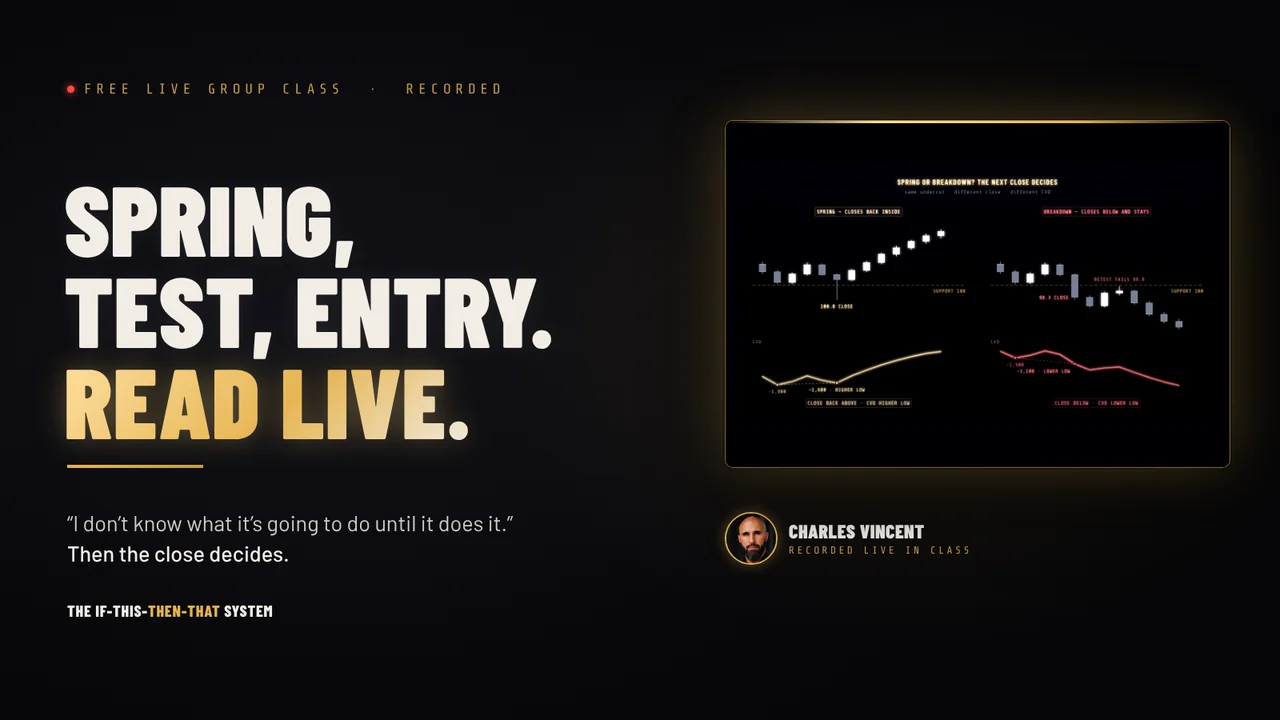
Spring, test, entry. Read out loud.
Charles walks one accumulation down from the weekly to the four hour, narrating every line as he draws it. Then Drew deletes every drawing on a section he had already worked, reads it again from scratch, freezes, and gets sent back to his checklist until the first safe entry is on the chart. The last quarter of the hour is questions from the room.
Watch the class and read the transcriptLive Group Session · 39:45
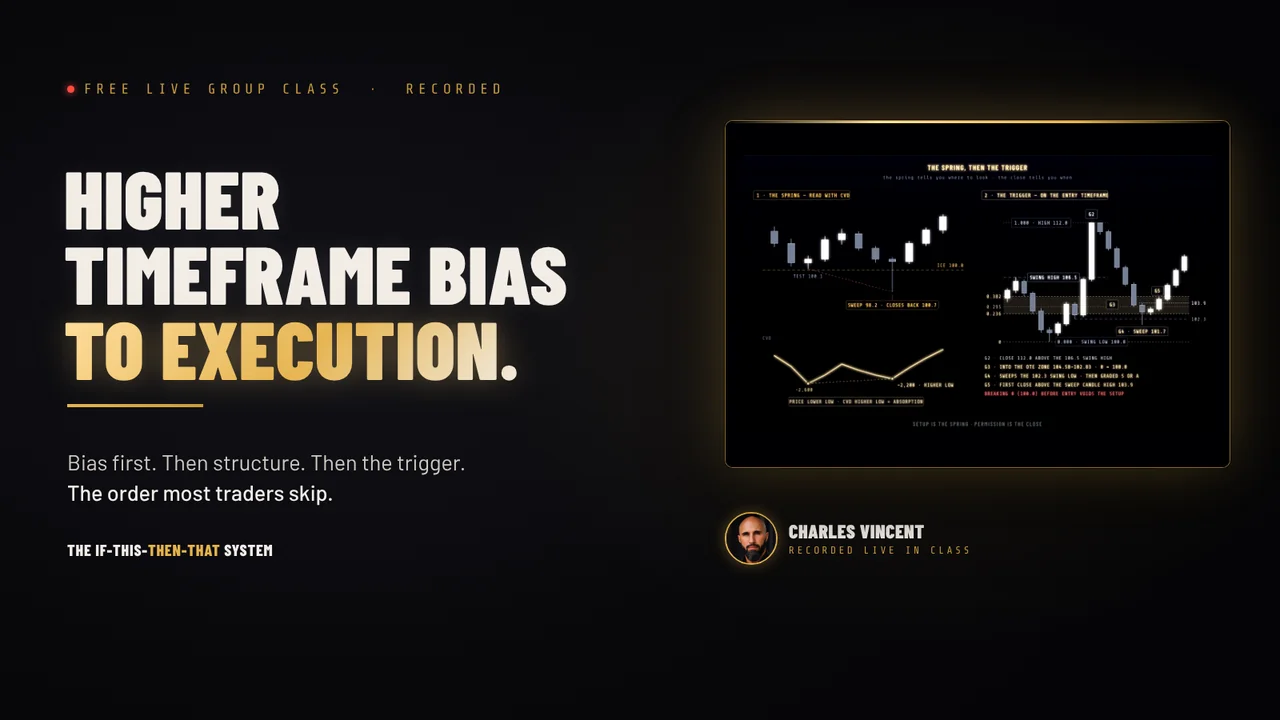
Higher timeframe bias, down to execution.
Most traders pick a direction first and then go looking for reasons to agree with it. This class runs the other way round: the higher timeframe is read for what it is actually saying, that read decides which setups lower down are worth looking at, and the entry is walked through bar by bar in TradingView’s replay.
Watch the class
Separately, three private 1-on-1 coaching sessions are published with the student’s permission. They are not classes: What are you looking at? (camera on), Structure, or fear? (camera on) and Elliott Wave, counted not drawn.
Next class · every Sunday · 22:00 UTC
Seen enough to be curious? Come and read one live.
03 Who It Is For
Built for the beginner.
It is for
Complete beginners first. If you have never looked at the volume bar under a candle, you are exactly who this class is for.
It is also for anyone who has learned a tenth of something, watched it fail, and decided the whole thing is fake. That is most people, and the class starts exactly there, with the one skill everything else sits on.
It is not
It is not the trade room. This class teaches you to read the chart. Copying my own trades as I take them, with the reason for each one, is part of the 90-Day Mentorship.
It is not a performance claim either. The documented results live on the protocol results page, with sample sizes attached.
04 How To Join
Four steps. Nothing to install.
- Put it in your calendar
It repeats every Sunday. The time at the top of this page is already converted to your own clock.
- Come back when it starts
The join button appears on this page about 15 minutes before the start. Or leave your email and the link comes to you.
- Open it in your browser
The class runs on kMeet. Chrome or Firefox work best, with no account to make and nothing to install. On a phone there is a free kMeet app, but charts are far easier to follow on a computer.
- Have a chart open
Only if you want to follow along. A free TradingView account is enough.
Ten minutes that make the hour land.
None of this is required. Each takes a few minutes, and the class builds on all three.
Read
Reading the tape
Effort versus result, the close as the verdict, and the four questions to ask on every bar. The written version of where the class starts.
Practise
The Tape Reader drill
Ten short sequences. The bars print one at a time and it stops on the bar that matters. Free, no sign-up.
The book
A Complete Guide to Volume Price Analysis
Anna Coulling. The book the class is built on, and worth buying. Not needed for the first class, but it is where the method is written down properly.
05 Straight Answers
Questions. Answered plainly.
Is it really free?
Yes. No card, no account and no sign-up to attend. The email reminder is optional.
What time is it where I am?
The time at the top of this page is converted to your own clock automatically. The class is fixed at 22:00 UTC, and UTC never changes for daylight saving, so your local time can move by an hour when your own clocks change.
How long is it?
Usually about an hour. The published classes run from 40 minutes to about an hour and a half.
Do I need to know anything first?
No. It starts from zero. The ten minutes of preparation above helps, but it is not required.
I missed it. Is there a recording?
Some classes are published whole, in the recordings on this page. Not every class is.
Where else is the link posted?
In the Telegram channel, about 15 minutes before each class. This page picks it up from there automatically.
07 One-On-One
Want this on your own charts?
The Sunday class is the group version of the work. The 90-day mentorship is the same method applied to your own charts, your own execution and your own mistakes, with Charles Vincent, three times a week. It starts with a free 30-minute application call, no card required.
The class is education, not a track record, and nothing said in it is a performance claim. Not financial advice, and not individualised to your situation.