Wyckoff Distribution on Bitcoin: How a Top Is Built, and How to Tell It From a Pause
Price runs up for months, then goes sideways near the high. Everybody calls it a rest before the next leg. Sometimes it is. Sometimes it is the biggest holders quietly handing their coins to the crowd. The chart looks the same in both cases until one candle closes.
Wyckoff distribution is a sideways range that forms after a long rise, in which large holders sell to late buyers without knocking the price down. It runs in five phases. A buying climax stops the rise, the range builds, a false breakout above the range (the UTAD) traps the last buyers, the floor of the range breaks on heavy volume, and the decline begins. On Bitcoin the same range can also be a pause that resolves higher, so the read is never final until the floor breaks and the rally back up to it fails.
What Distribution Is, in Plain Words
Think of someone who owns a warehouse full of something and wants to sell all of it. If they put the whole warehouse on the market in one morning, the price drops before they are a tenth of the way through. So they sell a little at a time, into days when buyers are lining up, and they keep the price looking healthy while they do it.
That is distribution. A large holder cannot sell a large position unless somebody is buying at the same moment. At the top of a long rise, the buyers are the people who waited, watched it go up, and finally could not stand being left out. The range near the high is where the two meet.
Richard Wyckoff mapped that range a century ago on stocks. It is the mirror image of accumulation, and it is much harder to see live. Accumulation happens when price is falling and nobody wants it, so the fear is obvious. Distribution happens when the trend has been up, sentiment is bullish, and the breakout above the range looks completely legitimate.
Not the shape. The behaviour inside the shape. That is what the rest of this guide is about.
The Five Phases of a Distribution, A to E
The schematic below is the same one drawn on the Wyckoff Method guide, with every label placed on the bar that makes it. The prices on it are illustrative. The sequence is the point.
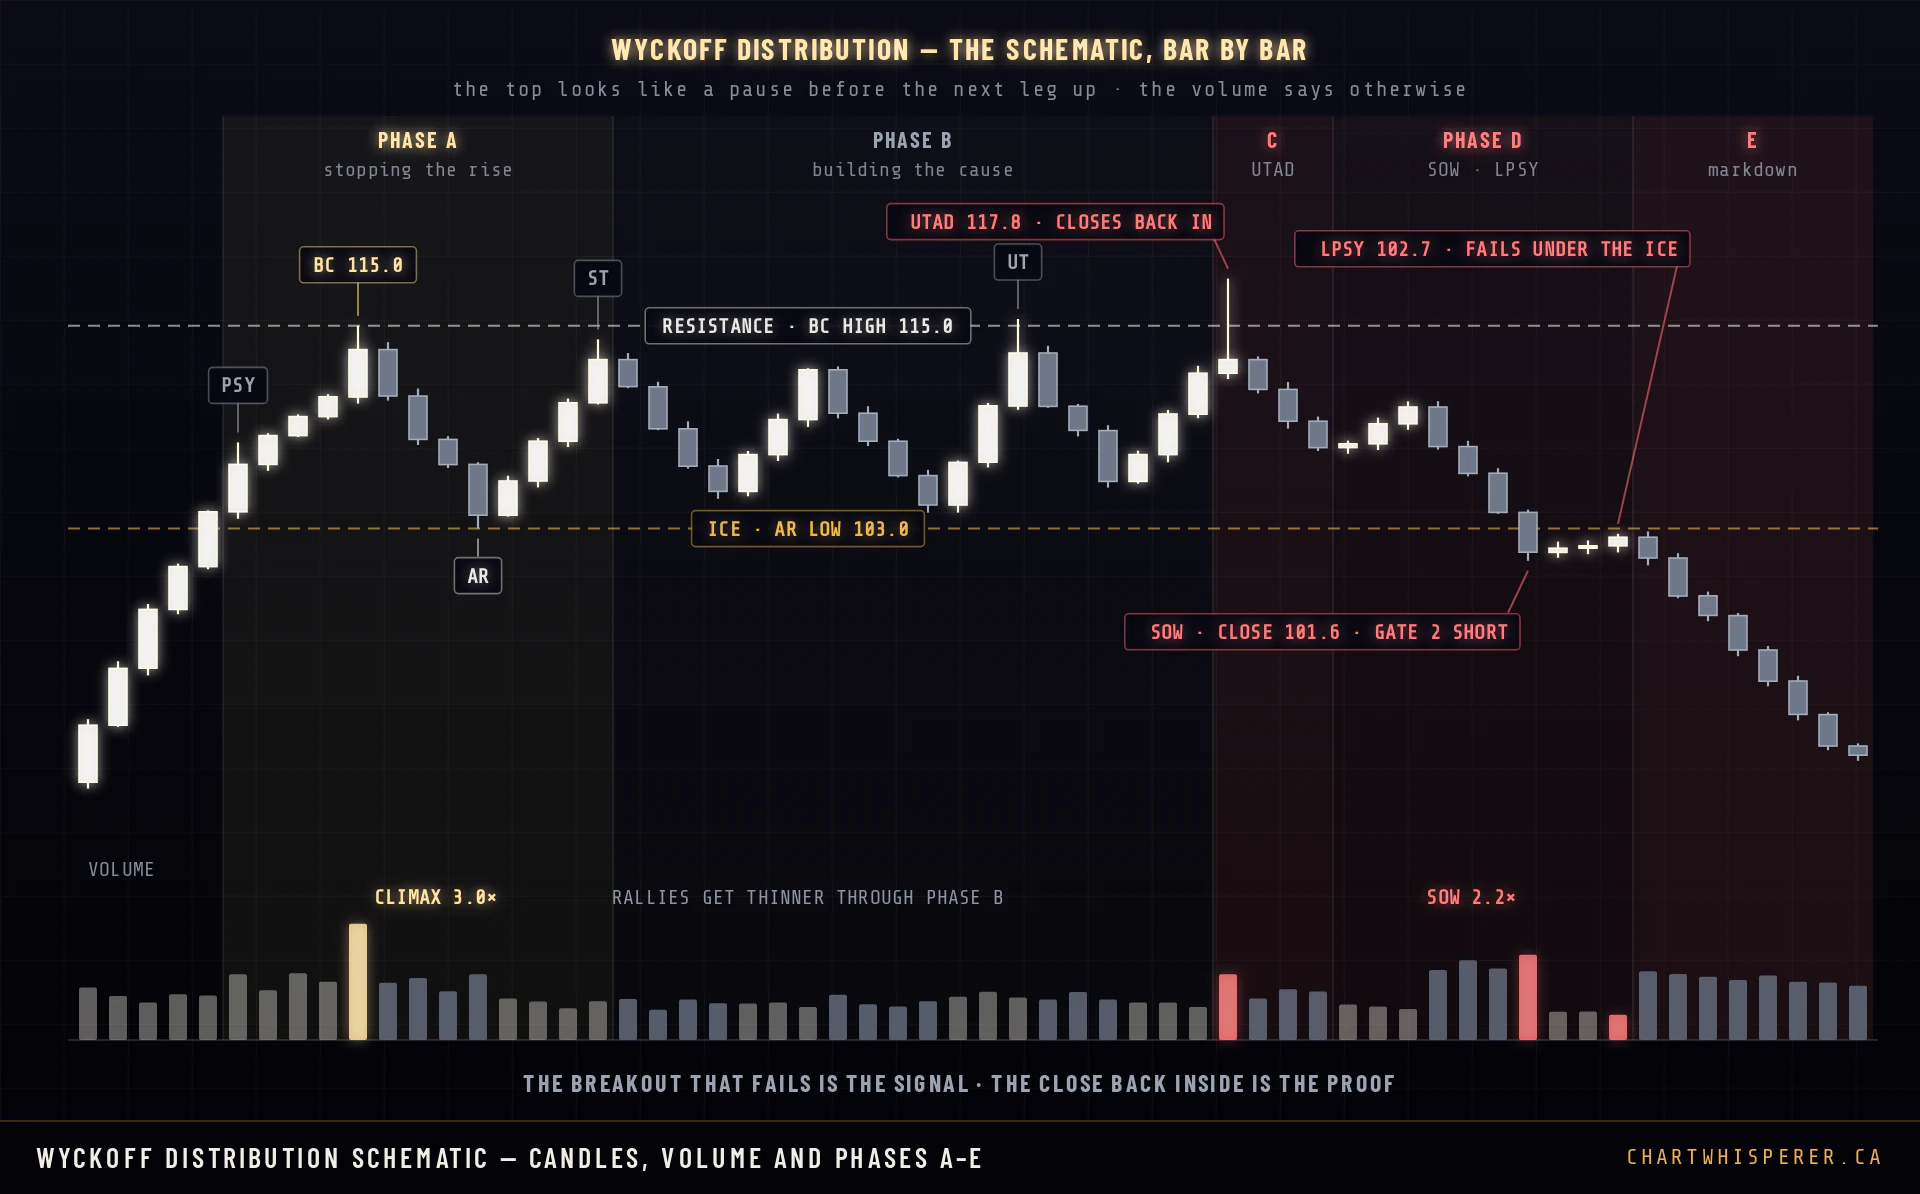
- Phase A stops the rise. Preliminary supply (PSY) is the first heavy selling into the advance. The buying climax (BC) is the high on the heaviest volume on the chart, 115.0 on the schematic. The automatic reaction (AR) is the drop that follows, and its low, 103.0, becomes the floor of the range. Wyckoff traders call that floor the Ice. A secondary test (ST) then goes back toward the high and fails below it.
- Phase B builds the range. Price moves between the Ice and the climax high, often for longer than anyone expects. An upthrust (UT) can probe above resistance and come back. This is where the selling gets done, and it is the phase with no trade in it.
- Phase C is the trap. The upthrust after distribution (UTAD) spikes above the range high, to 117.8 on the schematic. Every breakout buyer gets filled and every short stop gets hit. Then the bar closes back inside the range, at 113.0.
- Phase D breaks the floor. The Sign of Weakness (SOW) is a close below the Ice on expanding volume, 101.6 on 2.2 times volume on the schematic. That is the bearish break of structure. The rally back peaks at 102.7, under the old floor. That failed rally is the Last Point of Supply (LPSY).
- Phase E is the markdown. Price leaves the range to the downside and the decline is under way.
The breakout that fails is the signal. The close back inside is the proof.
UTAD or Breakout: the One Candle That Decides
The most expensive question at a top is whether the spike through resistance is a real breakout or a UTAD. Until that bar closes, the two are indistinguishable. That is exactly why the UTAD traps so many people.
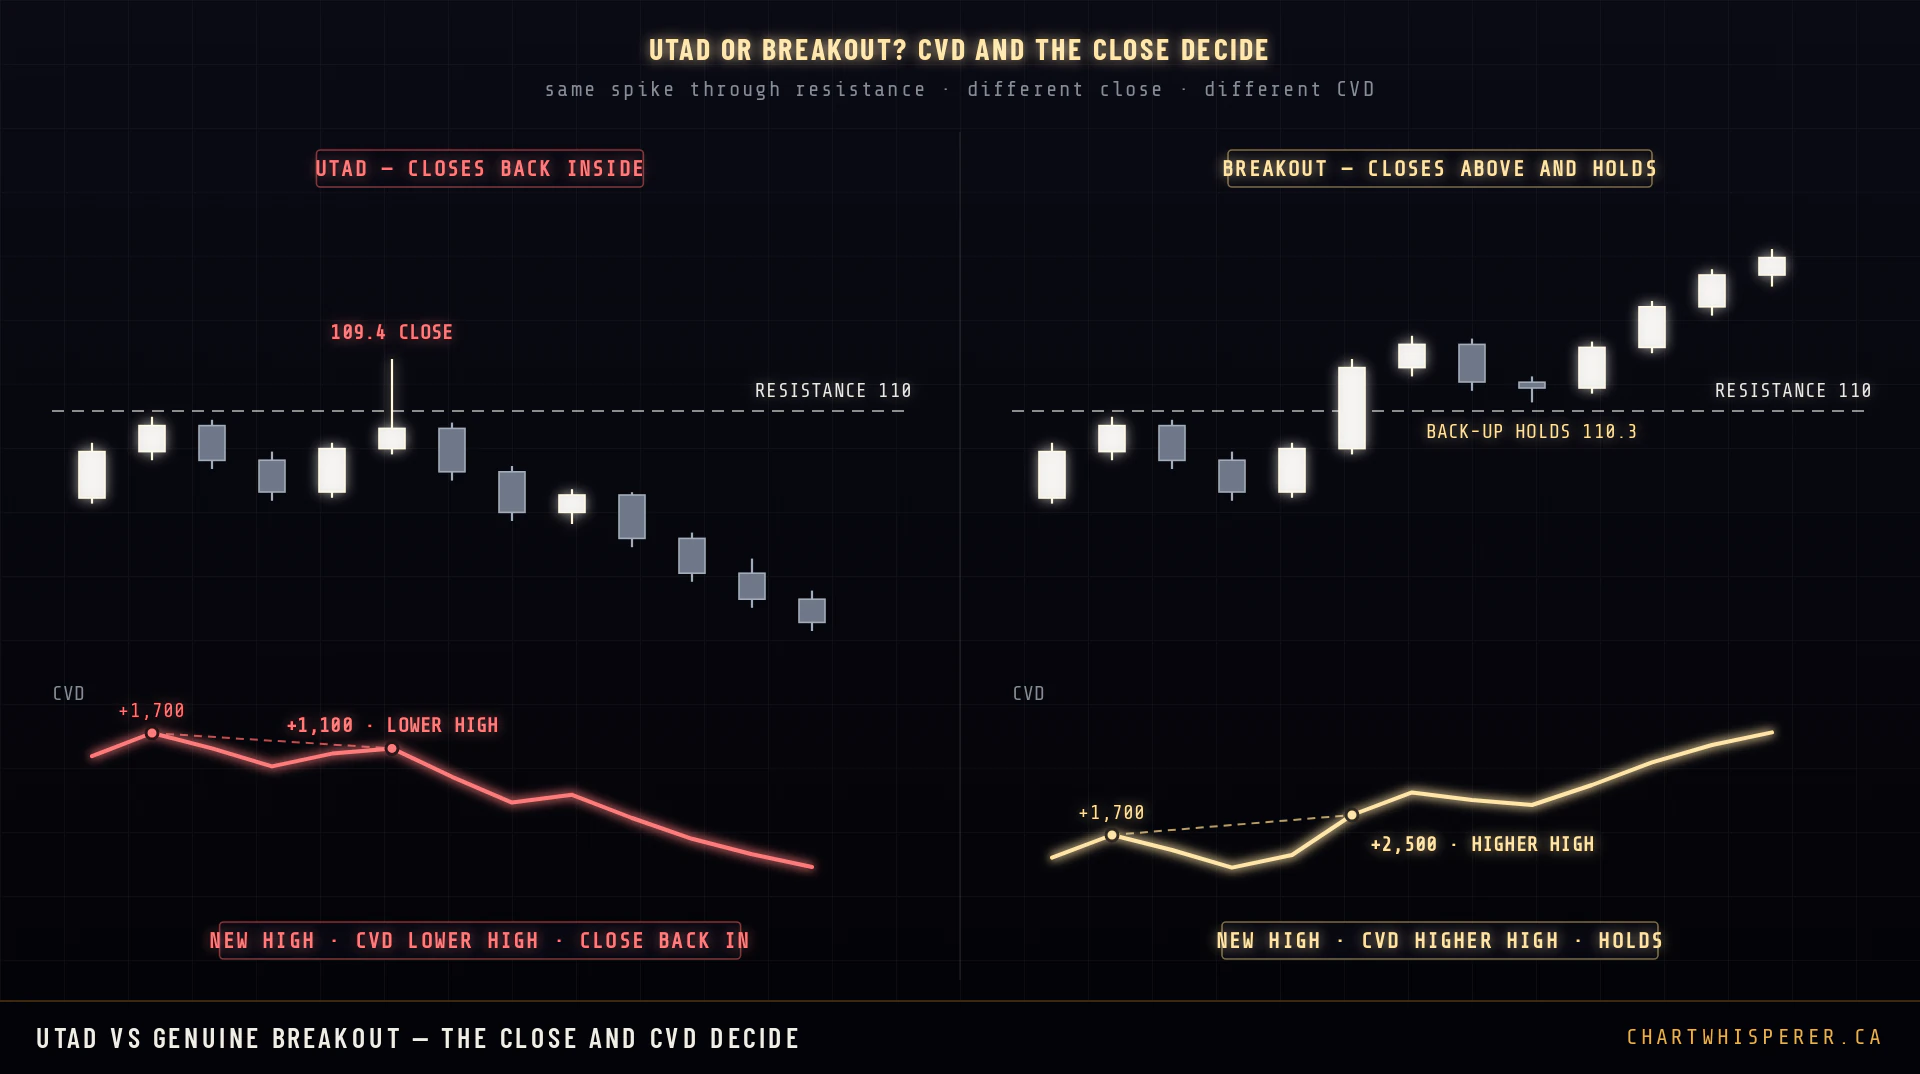
Two witnesses decide it, and they are the same two Wyckoff used at the lows.
- The close. A UTAD closes back inside the range. A genuine breakout closes above the level, and the pullback after it, the back-up, holds on top of the old ceiling.
- The order flow underneath. On a genuine breakout, CVD rises with price, because aggressive buyers are responsible for the move. On a UTAD, price makes a new high and CVD does not. The new high was not bought by aggressors. It was sold into.
In the diagram both panels spike to 111.8 through resistance at 110. On the left the bar closes back inside at 109.4 and CVD peaks lower than it did at the earlier high. On the right the bar closes at 111.5, CVD makes a higher high, and the back-up holds at 110.3. Same spike. Opposite meaning.
Never buy the spike, and never short it either. Act on what the close and the retest prove. The CVD divergence is evidence you weigh, not a trigger, and CVD has blind spots of its own that the CVD guide covers.
Top or Pause: Distribution Against Re-accumulation
The range question comes before the spike question, because it decides which spike you should even be expecting. A range that forms after an uptrend can be distribution, or it can be re-accumulation, a pause before the next leg up. On a live chart they can look identical for weeks. Guess wrong one way and you short a market that is about to run. Guess wrong the other way and you buy the top.
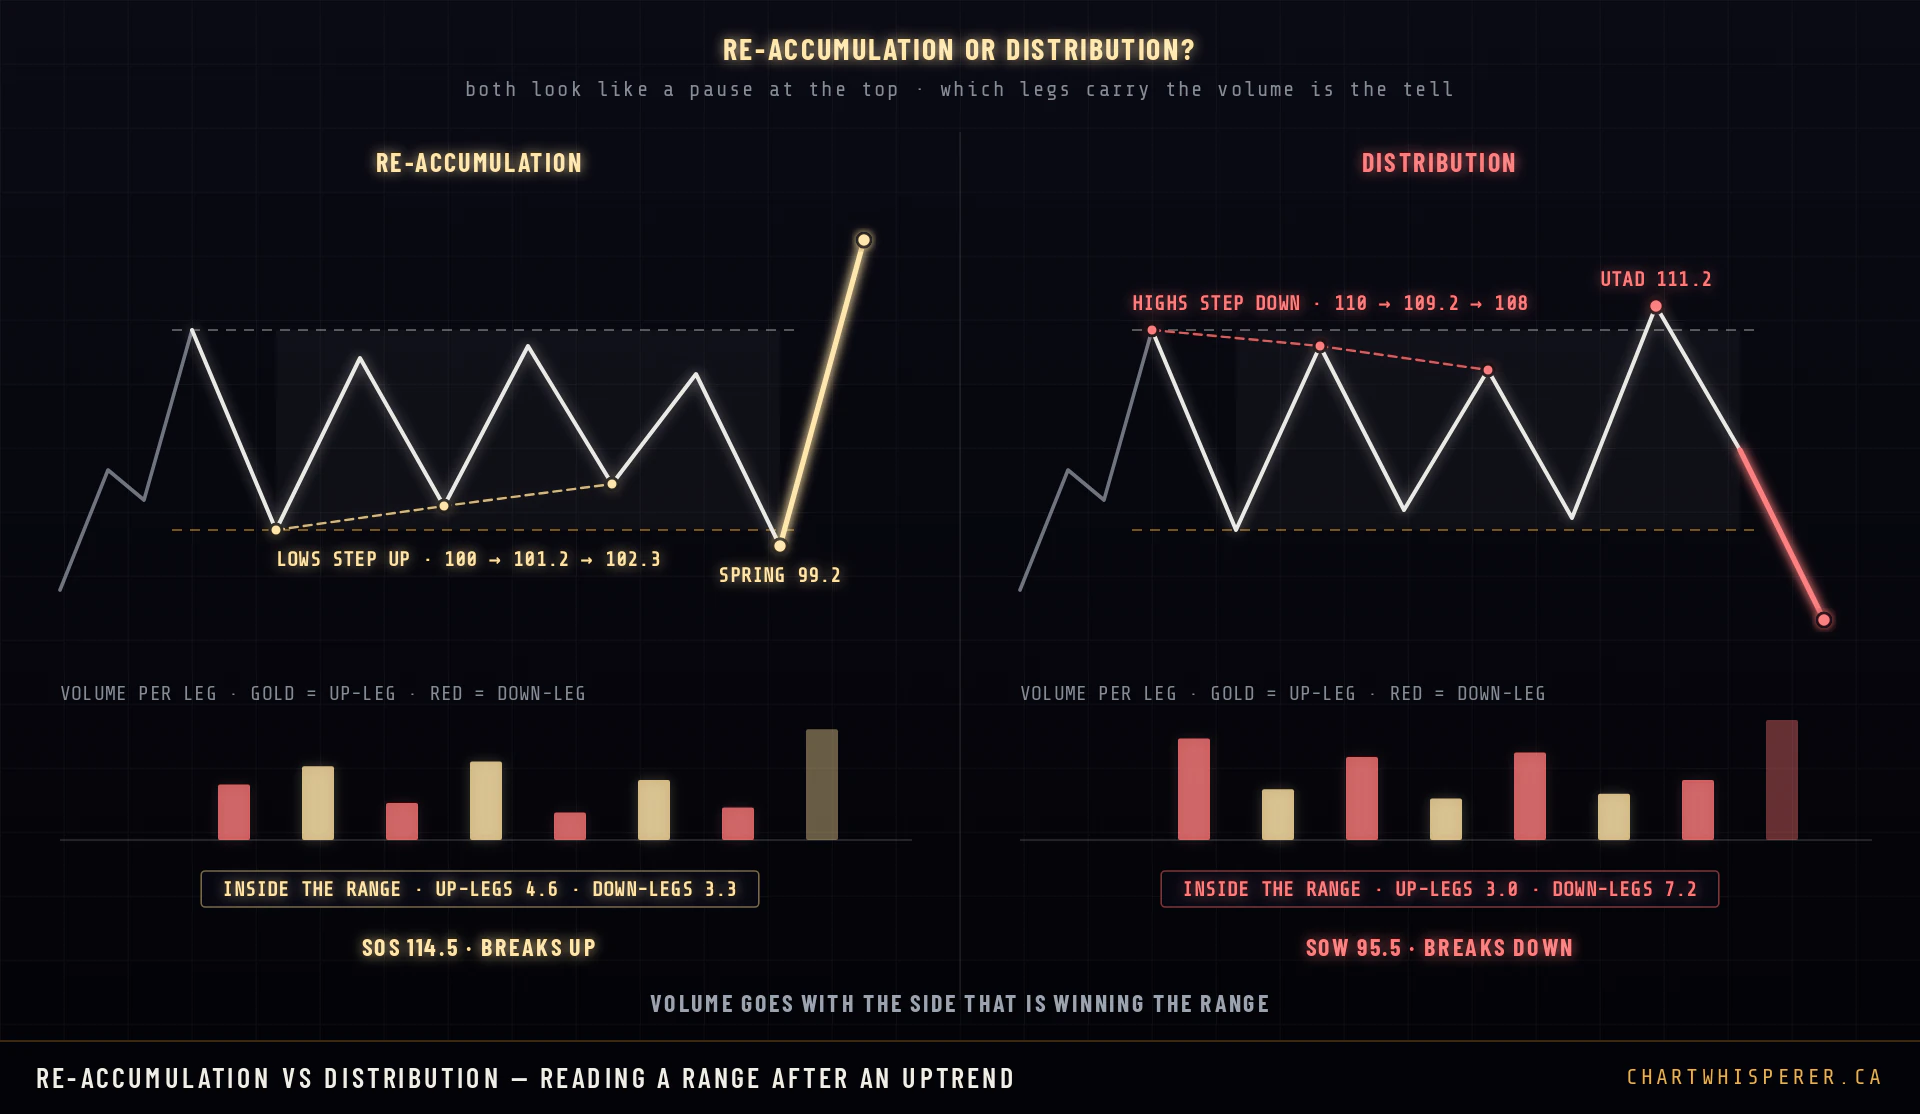
Three tells separate them.
- Which legs carry the volume. In re-accumulation the up-legs inside the range trade more volume than the down-legs. In distribution the down-legs carry it. Volume goes with the side that is winning the range.
- Which way the swings step. Rising lows inside the range point to re-accumulation. Falling highs point to distribution.
- Which side gets tested. Re-accumulation tends to end with a spring under support that holds. Distribution tends to end with an upthrust over resistance that fails.
There is a fourth read that sits under all three, and it is the one I teach bar by bar in the tape reading classes: effort against result. In distribution, rallies take heavy volume and make little progress, while declines come easily. When the effort is on the way up and the result is not there, somebody is selling into it.
None of these is a verdict by itself. No read is final until a range edge breaks and the retest confirms it.
What Changes on Bitcoin
Wyckoff wrote for stocks that closed every afternoon. Bitcoin perpetuals trade around the clock with leverage, and three things follow from that.
- The traps are precise. The UTAD on a Bitcoin chart tends to reach for the most obvious cluster of stops above the range high and no further. A spike that takes the cleanest high on the chart and closes straight back inside deserves attention.
- Funding shows you how crowded the trade is. Funding is the fee leveraged longs and shorts pay each other. Strongly positive funding as price pushes above a range high means the crowd is leaning hard to the long side. That is context for a UTAD read. It is not a trigger, and it is not one of the checks the CAP grades.
- Degree matters. Wyckoff ranges exist on every timeframe. Bitcoin can be distributing on the 4-hour chart inside a weekly structure that is still accumulating. A small top inside a bigger uptrend is a pullback, not the end of the move. Name the timeframe before you name the phase.
Five Distribution Mistakes
- Shorting Phase B. This is the most expensive one. It means acting before the UTAD has fired and before structure has broken, inside a range that may be re-accumulation.
- Shorting the spike before the bar closes. A UTAD and a breakout are the same candle until the close. Shorting into a real breakout is how accounts get run over.
- Calling every range after a rally a top. Most pauses in an uptrend resolve with the trend. The three tells above exist so the range has to prove it is distribution.
- Reading one timeframe. A distribution on a low timeframe says nothing about the weekly. Check the degree above the one you are trading.
- Treating the schematic as a forecast. The schematic is a framework, not a template. Real ranges skip events, repeat them and bend. Every read needs a level that proves it wrong.
Where Distribution Sits in the CAP
The CAP is five gates in a fixed order, and the Wyckoff phase feeds the first one. Gate 1 is regime: trade only with the bigger move. Distribution turning into markdown means shorts only. It does not mean shorts yet.
The gates then run the same way they do on the long side, in reverse. The UTAD flags the setup. The Sign of Weakness close below the Ice is the Gate 2 break of structure, and it has to be a candle body close, not a wick. The failed rally back to the old floor, the LPSY, is where Gates 3 to 5 do their work.
Upfront, so nobody has to work it out: the published backtest does not carry a separate win rate for distribution reads, and I am not going to invent one here. What the backtest does and does not show, including its losing stretches, is on Protocol Results. This page gives you the pattern. The protocol is what decides whether there is a trade.
Is Bitcoin in Distribution Now?
That answer changes, so it does not live in this guide. The current read, with the phase, the levels and the close that would prove it wrong, is on the Bitcoin Wyckoff phase page. It is updated in place, so it stays the single current answer. Ethereum has its own.
Frequently Asked Questions
What is Wyckoff distribution?
Wyckoff distribution is a sideways range that forms after a long rise, in which large holders sell their position to late buyers without knocking the price down. It is the mirror image of accumulation. It runs in five phases: a buying climax stops the rise, the range builds, a false breakout above the range traps the last buyers, the floor of the range breaks, and the markdown begins.
What does Wyckoff distribution look like on Bitcoin?
It forms after a markup. Preliminary supply and a buying climax mark the top of the move, an automatic reaction sets the range low, and secondary tests probe the high and fail below it. The trap comes in Phase C as an upthrust after distribution (UTAD): a push above the range high that catches breakout buyers and closes back inside. In Phase D the range low, the Ice, breaks on a Sign of Weakness, the rally back fails beneath it, and the Phase E markdown follows. The same shape can also be re-accumulation, so no read is final until the Ice breaks and stays broken.
What is a UTAD in Wyckoff?
UTAD stands for upthrust after distribution. It is the Phase C trap: price spikes above the top of the range, fills the breakout buyers and the short stops resting there, and then closes back inside the range. It is the mirror of the spring in accumulation. Until the bar closes, a UTAD and a genuine breakout look identical.
How do you tell a UTAD from a real breakout?
By the close and by the order flow underneath. A UTAD closes back inside the range, and CVD makes a lower high while price makes a higher one, which means the new high was sold into. A genuine breakout closes above the level, CVD rises with price, and the pullback that follows holds on top of the old ceiling.
How do you tell distribution from re-accumulation?
Both are ranges that form after an uptrend. Three tells separate them. In distribution the down-legs carry more volume than the up-legs, the highs inside the range step down, and the range ends with an upthrust over resistance that fails. In re-accumulation the up-legs carry the volume, the lows step up, and the range ends with a spring under support that holds. No read is final until a range edge breaks and the retest confirms it.
When do you short a Wyckoff distribution?
Not in Phase B, and not on the UTAD spike. In the CAP Framework the UTAD only flags the setup. The Sign of Weakness, a candle body close below the floor of the range, is the break of structure, and the failed rally back to that old floor, the Last Point of Supply, is where an entry is worked. Shorting before structure has broken is the most expensive Wyckoff mistake.
Is Bitcoin in a Wyckoff distribution right now?
That answer changes, so it is kept on one page that is updated in place: the Bitcoin Wyckoff phase read at chartwhisperer.ca/btc-wyckoff-phase. It gives the current phase, the levels and the close that would prove the read wrong.
Get the Free CAP Framework Course
Six days. Wyckoff, Elliott Wave, CVD, the 5-gate protocol, risk sizing and execution psychology — the complete foundation behind every setup on this site, delivered one lesson a day to your inbox. Plus the 8-Point Setup Gate Checklist on Day 1.
The schematic is the map. The CAP is the order.
The CAP Framework puts the regime, the break, the CAP zone, the sweep and grade, and the trigger in one fixed order, backtested on BTC, ETH, SOL and LINK. The Wyckoff phase tells you which side of the market you are allowed to be on. The gates decide whether there is a trade.
Explore the CAP Framework →Not ready to commit? Start with the free 8-Point Checklist →
Ready to go deeper? See the 90-Day Mentorship →