New · Effort vs Result indicator for TradingView
Tape Whisperer who won the candle, in plain English.
Volume is the gas. How far price travels is the distance. Tape Whisperer weighs every closed candle against the one before it, and tells you who won it and whether pushing is getting easier or harder.
- One payment, yours for life
- Runs on TradingView’s free plan
- Included in the 90-Day Mentorship
TCW · TAPE WHISPERER · PROlast closed candle
- Ease
- Pause · low volume, nobody pushing
- Weighed against
- The bar before (also up): 0.1x its distance on 0.4x its volume
- Last bar
- Normal bar. Effort and result match.
- Decisive close
- No · closed back inside the last bar
- Trend
- Down-leg · WEAKENING · new low on 49% less volume, 67% less ground · 1.5x harder
- Last key bar
- ▲ Range Breaker · 1 bar ago
A read, not a signal. It matters most at your levels.
01 Start here
Every candle is a car trip
You don’t need any trading words for this. The volume bar under each candle is the gas it burned. How far price moved is the distance it covered. Compare each trip with the one before it, and the chart starts telling you who’s in charge.
It got easier
More distance on less gas. The road just opened up for that side.
ETH 4H, 26 Oct, 23:00: 1.7x the distance on 0.5x the gas. Pushing down got 3.2x easier.
It got harder
More gas, less distance. Still moving, but someone is leaning against it, like a semi-truck braking.
ETH 4H, 18 Sep, 11:00: 0.4x the distance on 1.3x the gas. Pushing up got 3.6x harder.
One candle swallows the rest
One candle undoes what the other side built over several, on less gas than they burned. That is momentum starting.
ETH 4H, 22 Aug, 23:00: 1.3x the distance of the last 2 down candles on 0.4x their gas. 3x easier, named MOMENTUM.
That comparison, candle after candle, is what traders call reading the tape. Richard Wyckoff did it by eye off a paper ticker more than a hundred years ago. It still works. It is also slow to learn and tiring to do on every bar. Tape Whisperer does the arithmetic on every closed candle and says the answer in words.
02 Read it in ten seconds
What you’re looking at
Hover any badge or name and it explains itself in a sentence. The box in the corner says the whole read in words.
03 A real read
One real read, candle by candle
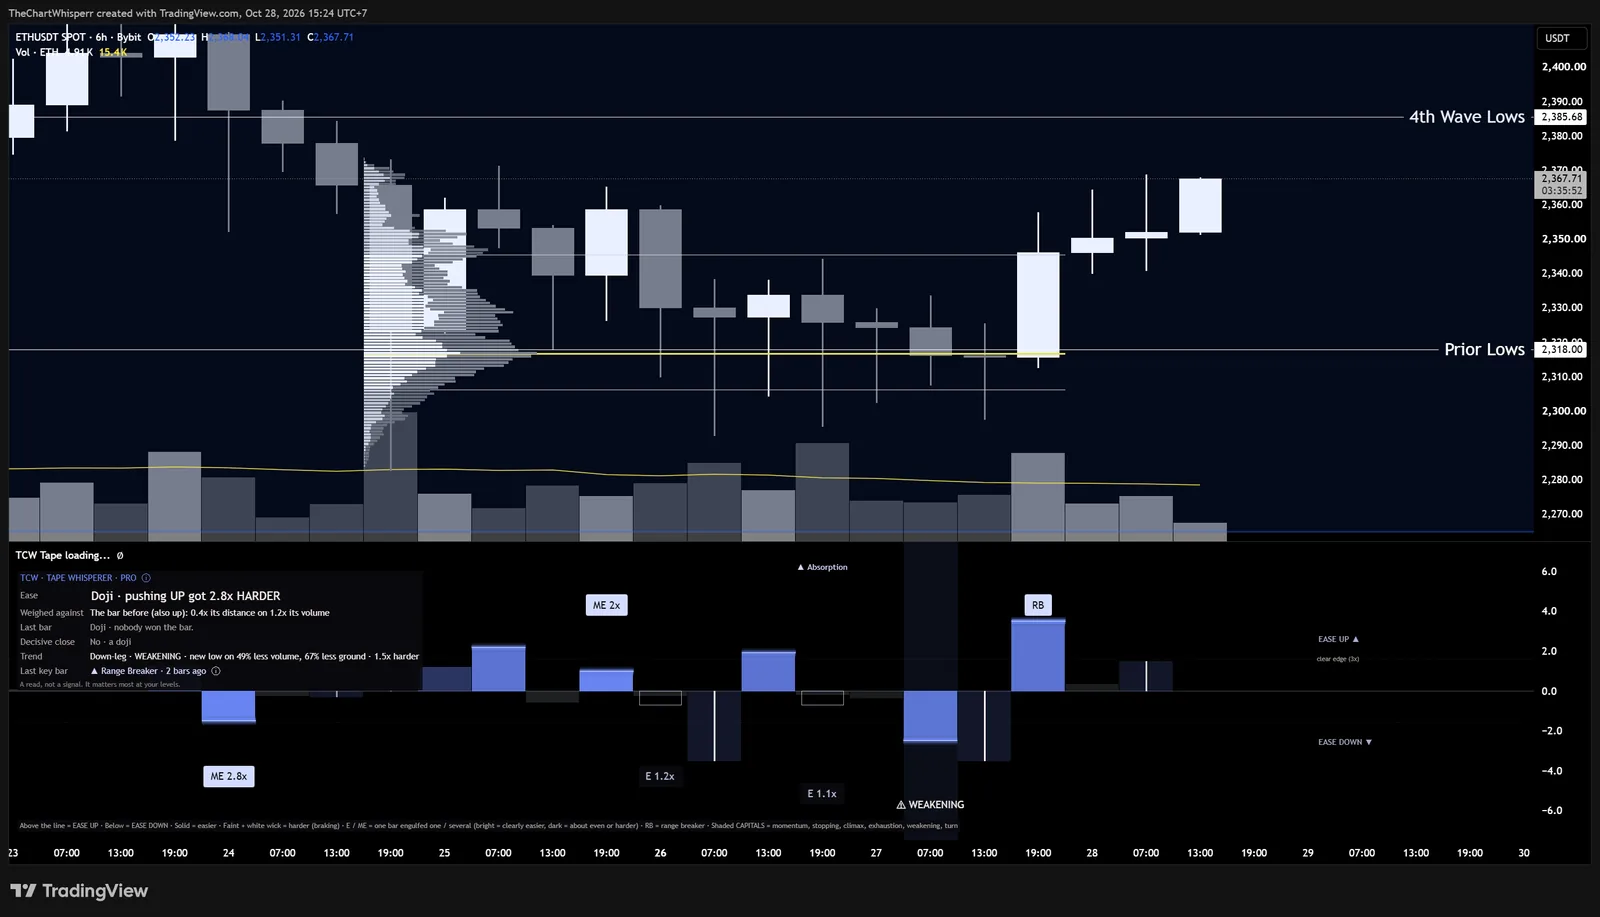
This is the chart from the top of the page, zoomed in. ETH had been falling for days. Here is what Tape Whisperer said about the last seven candles, in the order they closed.
- Absorption. Sellers threw 1.6x a normal candle’s volume at it, and price closed only 0.4x a normal candle’s distance lower. Big effort, little result: somebody was taking everything they sold.
- WEAKENING. A new low for the down-leg, made on 51% of the volume its earlier new lows averaged. Price still falling, fewer sellers joining.
- The doji. 1.2x the volume of the candle before it for 0.1x the distance. Pushing down got 12x harder. The sellers threw everything they had at it and it barely moved.
- Range Breaker. One candle’s body swallowed the bodies of the last 6 and closed above their whole range. Against the doji before it: 38x the distance on 1.9x the volume, 20x easier to push up.
What price does after the last candle isn’t known as this is written, and that is the point. The tool told you who won each candle and how hard they had to work. Whether to act is your call, at your level, inside your plan.
04 The names
Six names for the moves that matter
Most candles just get a colour. When something important happens, the bar is shaded and named. The Beginner view shows four names. Pro adds two more.
▲▼Momentum
One side just took control. A candle swallowed the other side’s candles and did it at least 3x more easily than they did.
▲▼Stopping
The biggest counter-trend volume in a while. Someone stepped in hard against the move. It can stop a move. It doesn’t turn it.
⚠Weakening
The trend is making new ground on clearly less volume than the pushes that built it. Fewer people joining.
▲▼Turn
Momentum starting right after the other side ran out. The strongest read on the chart.
⚠ClimaxPro
A move makes new ground on the widest candle and the biggest volume in a while. The panic, or the euphoria, that often comes near the end.
⚠ExhaustionPro
The push strains at a new extreme: more gas, less distance. A warning, not a turn. The truck is braking, but still rolling.
In the Beginner view, Climax and Exhaustion both read as Weakening.
05 What makes it different
Bar against bar. Not against an average.
Most volume tools compare each candle with an average of the last twenty. That smooths away the one thing a tape reader looks at: what changed from the candle before.
| Most effort-versus-result tools | Tape Whisperer |
|---|---|
| Weigh a candle against an average of recent candles. | Weighs it against the candle right before it. |
| Treat each candle on its own. | When a candle swallows several of the other side’s, weighs it against all of them stacked. |
| Give you a colour, a band or a line. | Gives you the numbers and a sentence: “1.3x their distance on 0.4x their volume.” |
It shows its working
Every read comes with numbers you can check yourself on the chart. Not a black box you have to trust.
Closed candles only
The candle still forming is left blank until it closes. Nothing is drawn, named or alerted early, so nothing repaints.
A doji means stalling
A doji has no side of its own. It reads as the running push getting harder, the way you’d read it by eye.
How we checked. In October 2026 we read the published effort-versus-result and VSA indicators on TradingView and in LuxAlgo’s library. Every one that explains its method measures a candle against an average, or compares whole swings. We didn’t find one that weighs each candle against the one before it, or an engulfing candle against everything it swallowed. If one exists, we’d like to see it.
06 Two views
Start simple. Switch to Pro when you’re ready.
One setting changes how much it shows. The maths underneath is the same in both. Below is the Range Breaker candle from the real read, in each view.
Beginner
Above the line is buyers, below is sellers, brighter is stronger. Four names, no badges, and a three-line read-out.
TCW · TAPE WHISPERER · BEGINNERTue 27 Oct 19:00
- Right now
- Buyers have the edge · 20x easier
- Trend
- Down · getting weaker
- Last move
- ⚠ WEAKENING · 2 bars ago
A read, not a signal. Use it at your levels.
Pro
Everything: the E and ME badges, range breakers, all six names, the key bars at recent highs and lows, and the full read-out.
TCW · TAPE WHISPERER · PROTue 27 Oct 19:00
- Ease
- EASE UP · 20x
- Weighed against
- The doji before (down push stalling): 38x its distance on 1.9x its volume
- Last bar
- Effort got paid. Big push up, and it moved.
- Decisive close
- Yes · closed above the last bar's high
- Trend
- Down-leg · WEAKENING · new low on 49% less volume, 67% less ground · 1.5x harder
- Last key bar
- ▲ Range Breaker · last bar
A read, not a signal. It matters most at your levels.
07 The honest part
A read. Not a signal.
I’ll say this upfront so nobody has to work it out. Tape Whisperer doesn’t predict anything. On its own, no read on it tells you what price does next, and any indicator that claims it can is selling you something else.
What it does is tell you who won each candle and how hard they had to work for it. That is worth the most at a level you already marked, inside a plan you already have. It’s the arithmetic I make students do by hand in class, done for you on every bar.
Exhaustion is a warning, not a turn. A semi-truck braking is still rolling, and price usually keeps going a little before it stops. Wait for the turn.
It needs real volume. If a symbol has none, it says so instead of guessing. For crypto, use an exchange feed like Bybit or Binance.
Charles Vincent · The Chart Whisperer
08 Get it
One payment. Yours for life.
TradingView indicator · invite-only
Tape Whisperer
$147USD · one-time · no subscription- The invite-only Tape Whisperer script on your TradingView account, for life, with every future update.
- Beginner and Pro views, one setting apart. The maths is the same in both.
- The plain-English read-out, and a sentence of explanation on every badge and name you hover.
- Six named moves, the E and ME engulfing badges, range breakers, and Shakeout, Upthrust and Absorption at recent highs and lows.
- 19 alerts, from Turn and Momentum to Stopping and Climax, fired only on closed candles.
- 13 colour themes, including Gold, Bitcoin, Ethereum and iridescent Solana, plus any colour of your own.
- Spacing for computer or phone, so names and badges never sit on top of each other.
Card or PayPal through Payhip. Or pay in BTC, ETH, SOL or LINK and save 5%.
Digital product: final sale once your TradingView access is granted. If it doesn’t work as described and I can’t fix it, you get your money back. Refund policy
Check out
Pay $147 by card, PayPal or crypto.
Send your username
Reply to your receipt with your exact TradingView username, or email hello@chartwhisperer.ca.
It’s on your chart
Access lands within 24 hours. Add it from Invite-only scripts in your indicators. It never expires.
In the 90-Day Mentorship? Tape Whisperer is included, along with the CAP, the Scanner and CAVI. Don’t buy it separately.
See the mentorship09 Questions
Asked and answered
What is Tape Whisperer?
A TradingView indicator by The Chart Whisperer. It weighs every closed candle against the one before it, using volume as the effort and the move from close to close as the result, and tells you in plain English who won the candle and whether pushing is getting easier or harder. It costs $147 once, or comes with the 90-Day Mentorship.
Do I need to know VSA or Wyckoff first?
No. The Beginner view needs nothing more than this: above the line is buyers, below is sellers, brighter is stronger. If you want to understand what it is doing, the free Reading the Tape guide teaches the same idea by eye.
Does it repaint?
No. It only reads closed candles. The candle still forming is left blank until it closes, and every name, badge and alert waits for the close.
Is it a buy or sell signal?
No. It is a read of who won each candle. On its own it doesn’t tell you what price does next. Use it at levels you have marked, inside your own plan.
Which markets and timeframes does it work on?
Any TradingView symbol that carries volume, on any timeframe: crypto, futures, stocks, and indices with volume. If a symbol has no volume at all, it says so instead of guessing.
Do I need a paid TradingView plan?
No. Invite-only scripts run on TradingView’s free plan. It counts as one of the indicators your plan allows on a chart.
How is it delivered?
After checkout, send your exact TradingView username by replying to your receipt or emailing hello@chartwhisperer.ca. Access is added to your account within 24 hours, and Tape Whisperer appears under Invite-only scripts in your indicators. It never expires, and every update reaches you on its own.
What if it’s not for me?
It’s a digital product, so it’s final sale once your TradingView access is granted. Read this page and the free tape-reading guide first, and email me any question before you buy. If it doesn’t work as described and I can’t fix it, you get your money back.
How is it different from CAVI?
CAVI answers one question: is there real momentum behind this move? It is a single line that ignites when trend strength confirms. Tape Whisperer reads each candle’s effort against its result. They answer different questions and sit well together on one chart.
Learn it free. Let the tool do the maths.
Learn to read the tape by eye with the free guide and the free Sunday class. When you’d rather not do the arithmetic on every candle, Tape Whisperer does it for you.
Tape Whisperer is an educational tool. It is not financial advice and not a trading signal. Trading carries substantial risk of loss, and on leverage you can lose more than you put in. Read the risk disclosure.