Chart Patterns: The 12 Classic Shapes, Drawn With the Line, the Stop and the Target
Head and shoulders, double bottom, bull flag. Most traders can name the shapes. Very few cheat sheets show the three things that decide whether a shape makes you money: the line a candle has to close through, the place you are wrong, and how far the move is measured. All twelve are below, drawn candle by candle, with those three on every one.
Chart patterns are shapes that price draws again and again while buyers and sellers fight over a level. Reversal patterns, such as the head and shoulders, double tops and bottoms and wedges, show a trend running out of fuel. Continuation patterns, such as triangles, flags and the cup and handle, show a pause inside a trend that is still going. Every one has the same three working parts: a line that a candle must close through to confirm it, a stop on the far side of the pattern, and a target measured from the pattern's own height. Until a candle closes through the line, it is a shape, not a pattern.
The Cheat Sheet: All 12 Patterns on One Page
Here is the whole set on one sheet. Six of them show a trend running out of fuel. Six show a pause inside a trend that is still going. Save it, print it, keep it next to your screen. It is free to reuse with credit, here is how.
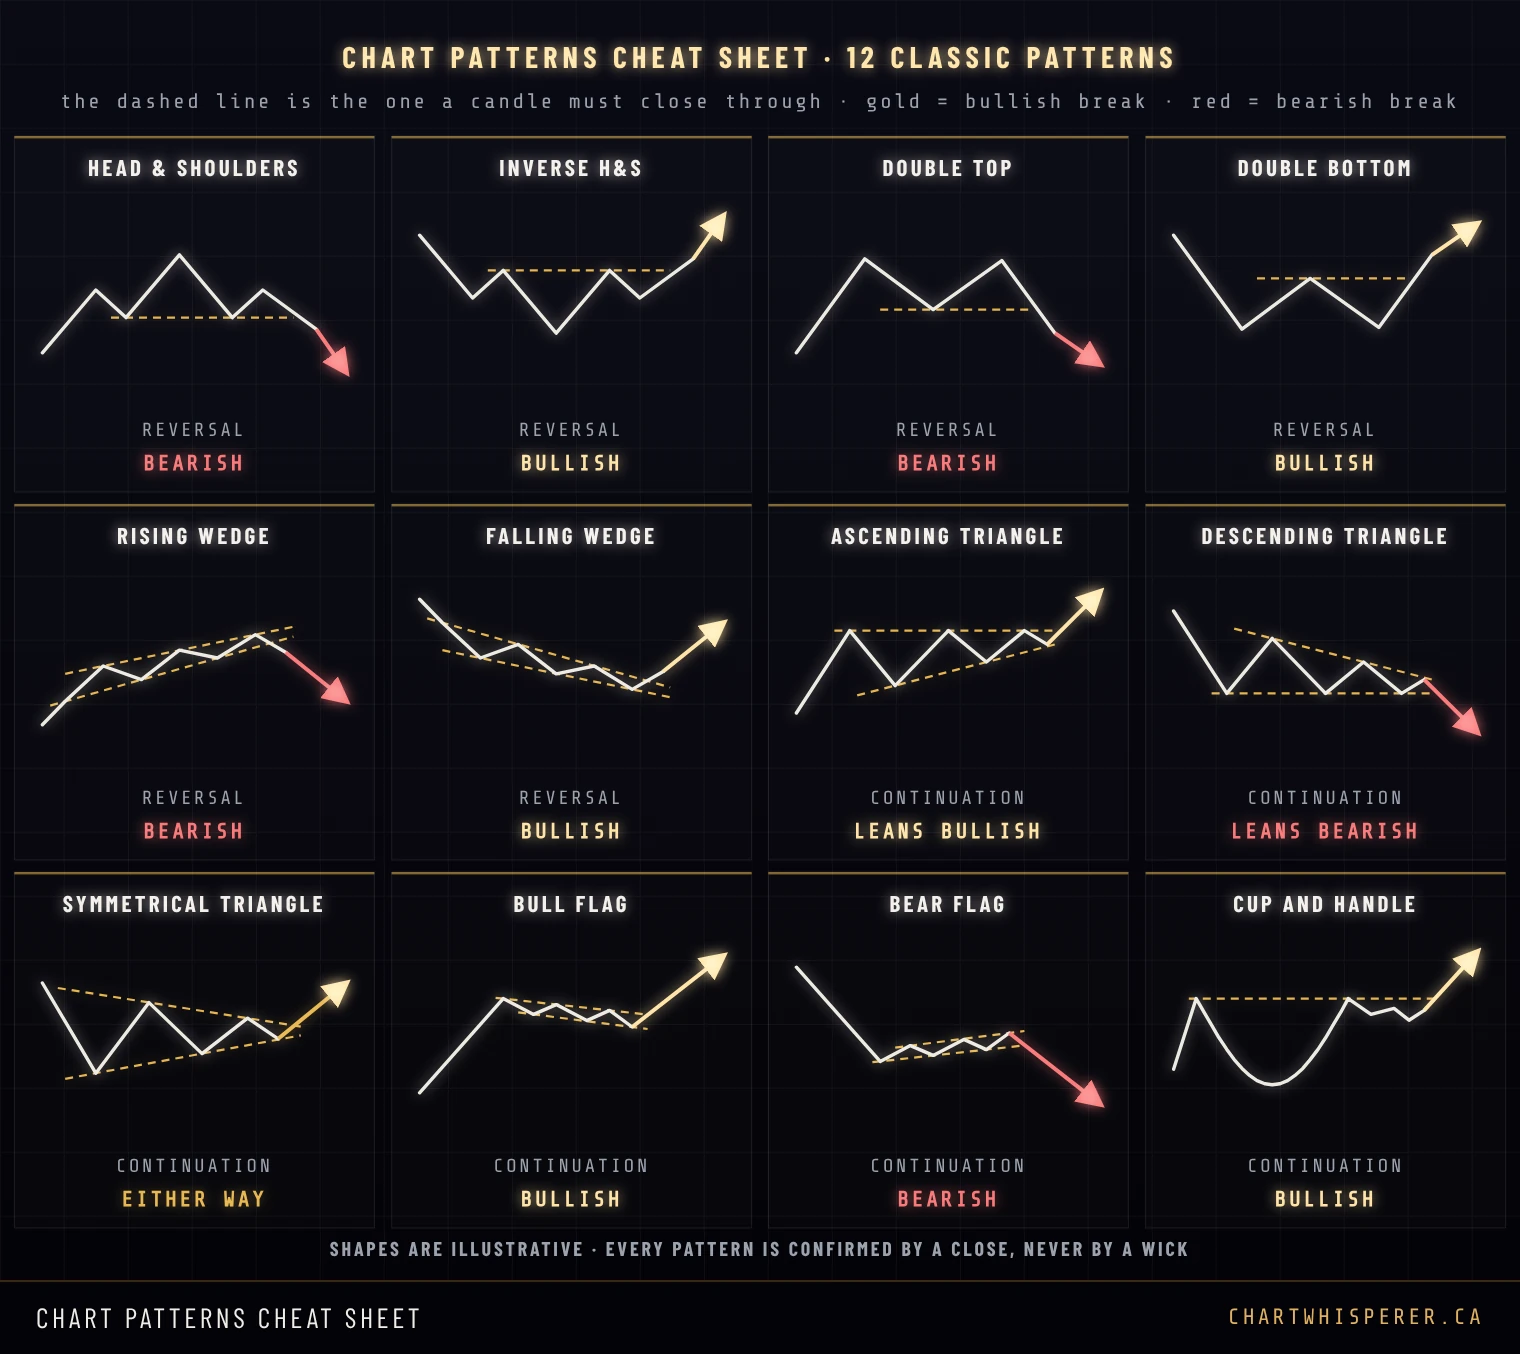
The gold arrows are bullish breaks and the red arrows are bearish ones. The dashed gold line in every box is the one that matters. Until a candle body closes through it, you are looking at a shape someone has named, not a pattern you can trade.
The Three Parts Every Pattern Has
Every pattern on this page works the same way underneath. Learn it once and the twelve shapes stop being twelve things to memorise.
- The line. Every pattern has one level that proves it. It is the neckline on a head and shoulders or a double top, the flat edge of a triangle, the edge of a flag, the rim of a cup.
- The close. A wick through the line proves nothing. Price can poke through a level, fill the orders sitting there and come straight back. The pattern is confirmed when a candle body closes on the far side of the line, on the timeframe you are reading.
- The stop and the target. The stop goes where the pattern would be wrong, on the far side of the structure that built it. The target is the pattern's own height, measured from the break. Both are set before the entry, never after it.
Most patterns also give you a second chance. After the break, price often comes back to the line from the other side. Old resistance gets tested as support, or old support as resistance. That retest is usually the cleaner entry, because the stop can sit just beyond it instead of beyond the whole pattern.
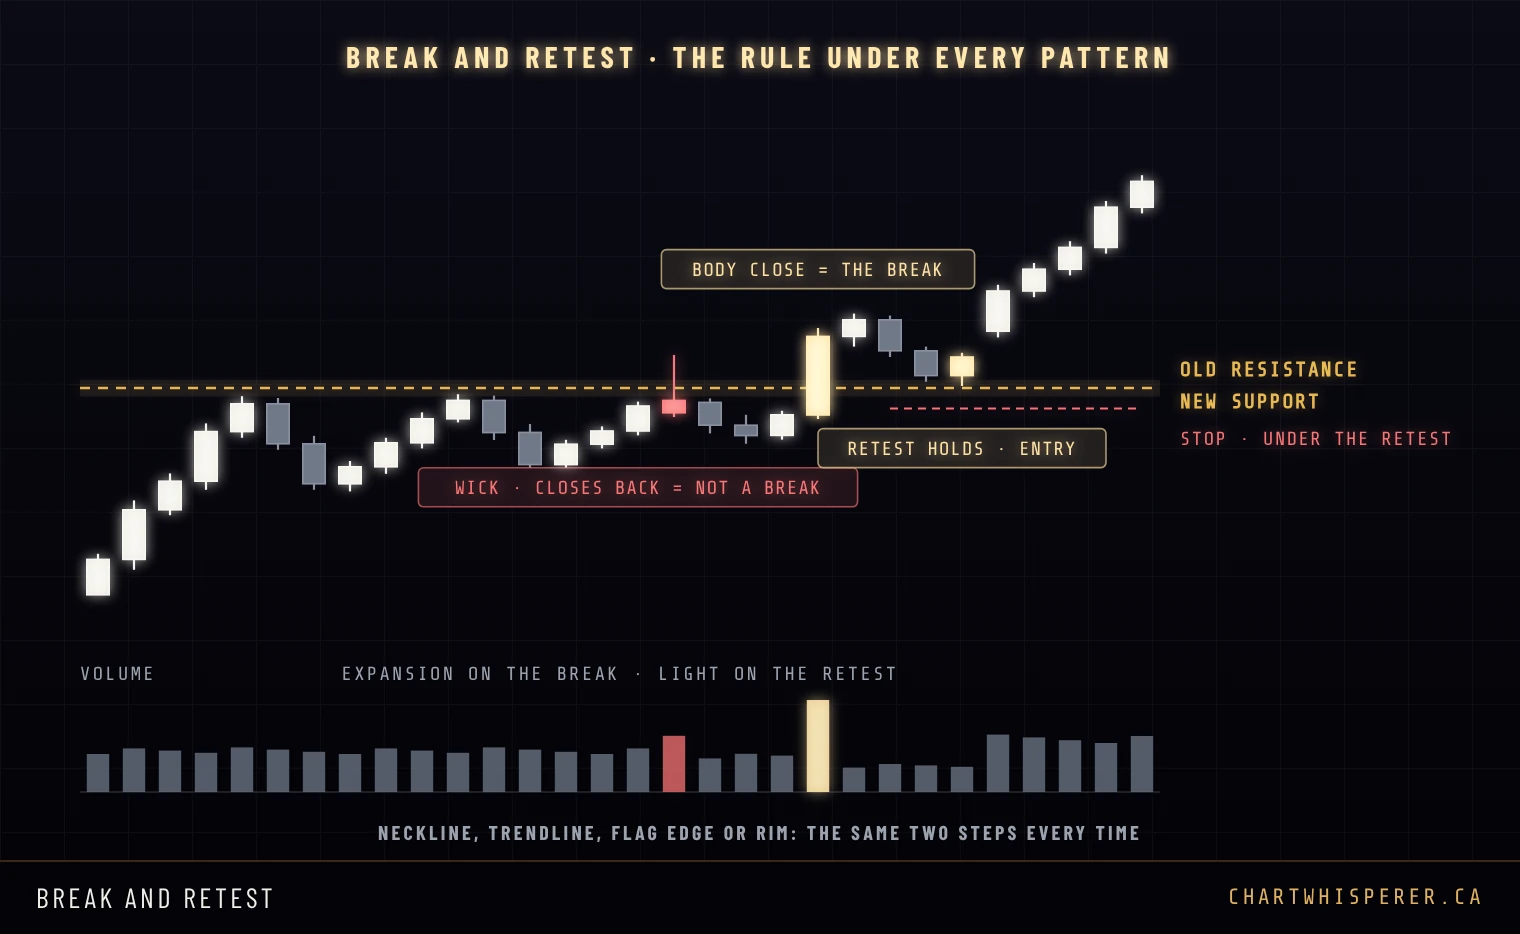
Here is every pattern in one table, so you can check a chart against it in a few seconds.
| Pattern | Bias | Confirmed by | Stop | Target |
|---|---|---|---|---|
| Head and shoulders | Bearish reversal | A close below the neckline | Above the right shoulder | Head-to-neckline height, down from the break |
| Inverse head and shoulders | Bullish reversal | A close above the neckline | Below the right shoulder | Head-to-neckline depth, up from the break |
| Double top | Bearish reversal | A close below the low between the peaks | Above both peaks | Peak-to-neckline height, down from the break |
| Double bottom | Bullish reversal | A close above the high between the lows | Below both lows | Low-to-neckline depth, up from the break |
| Ascending triangle | Leans bullish | A close above the flat top | Below the last rising low | Height at the widest part, from the break |
| Descending triangle | Leans bearish | A close below the flat bottom | Above the last falling high | Height at the widest part, from the break |
| Symmetrical triangle | Either way | A close outside either line | Beyond the last swing inside the triangle | Height at the widest part, from the break |
| Bull flag | Bullish continuation | A close above the upper flag line | Below the flag low | The pole's height, from the break |
| Bear flag | Bearish continuation | A close below the lower flag line | Above the flag high | The pole's height, from the break |
| Rising wedge | Bearish | A close below the lower line | Above the last high in the wedge | Back to where the wedge began |
| Falling wedge | Bullish | A close above the upper line | Below the last low in the wedge | Back to where the wedge began |
| Cup and handle | Bullish continuation | A close above the rim | Below the handle low | The cup's depth, up from the rim |
Head and Shoulders, and the Inverse
Three pushes up. The middle one goes highest. The last one cannot even reach the first. That is a head and shoulders top, and it is the most famous reversal pattern there is, because it shows a trend failing in steps you can see.
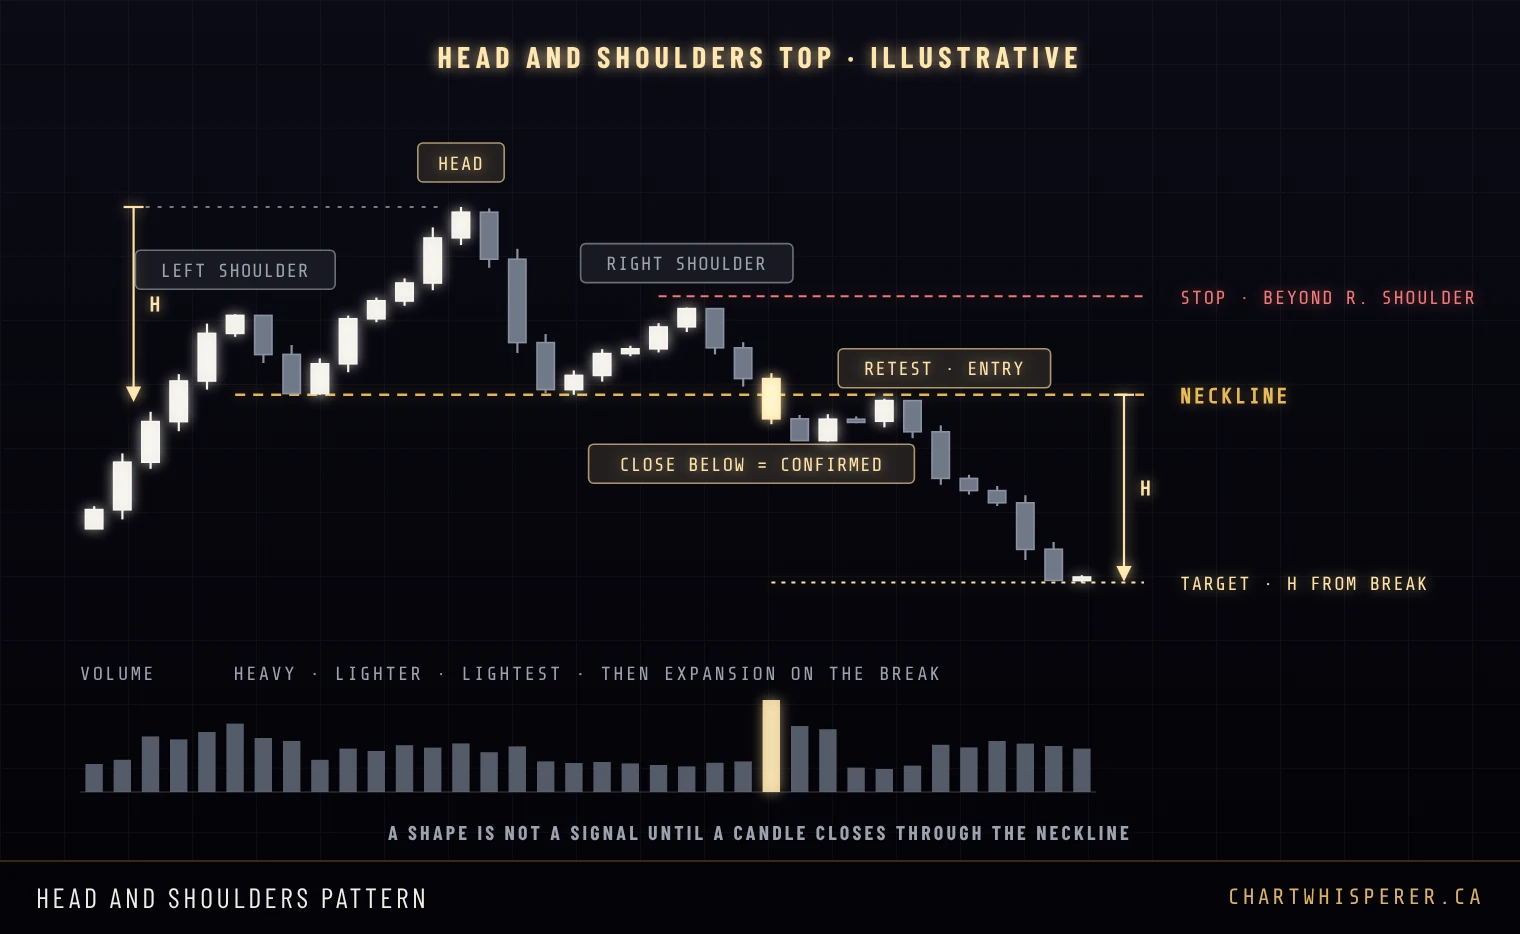
The left shoulder is the trend still working: a new high on strong volume, then a pullback. The head makes a higher high, on less volume, and the pullback from it falls back to the same level as the first one. The right shoulder is the tell. Buyers try again and stop short of the head, on the lightest volume of the three. A line across the two lows between them is the neckline.
The pattern is confirmed when a candle closes below the neckline. That close is a break of structure: the last higher low of the uptrend is gone. The stop sits above the right shoulder, because a push back over it means the sellers never took control. The target is the height from the head down to the neckline, measured down again from the break. Price often comes back up to retest the neckline from underneath first, and that retest is the cleaner entry.
If you know Wyckoff, you have seen this shape before. A head and shoulders top is often the outline of a Wyckoff distribution, and the head is often the upthrust that traps the last buyers before the floor gives way.
The inverse head and shoulders
Turn it upside down and you have the inverse head and shoulders, the same structure at the bottom of a downtrend.
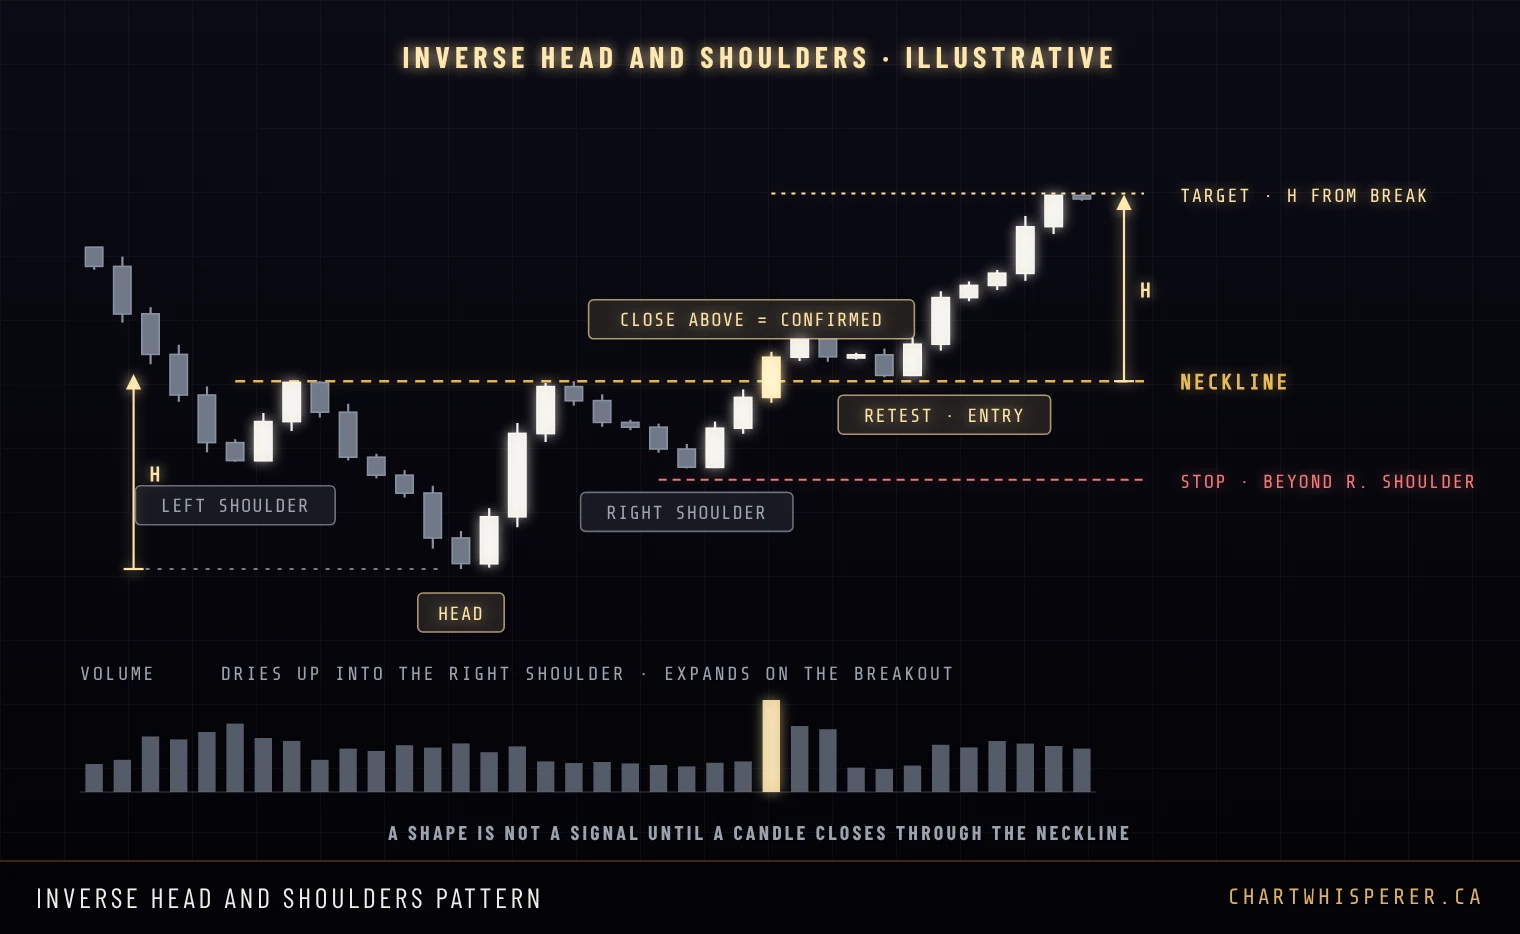
The lowest low is in the middle, the right shoulder holds above it, and the neckline runs across the two rally highs. A close above the neckline confirms it, the stop goes under the right shoulder, and the target is the head-to-neckline depth projected up from the break. Volume matters more on this one than on the top. Prices can fall on their own weight, but they need buyers to rise, so a breakout that clears the neckline on thin volume is the one that comes back.
Double Top and Double Bottom
Price hits a high, falls, comes back to the same high and fails again. Two tries at the same ceiling, and the second one had fewer buyers behind it. That is a double top, the M.
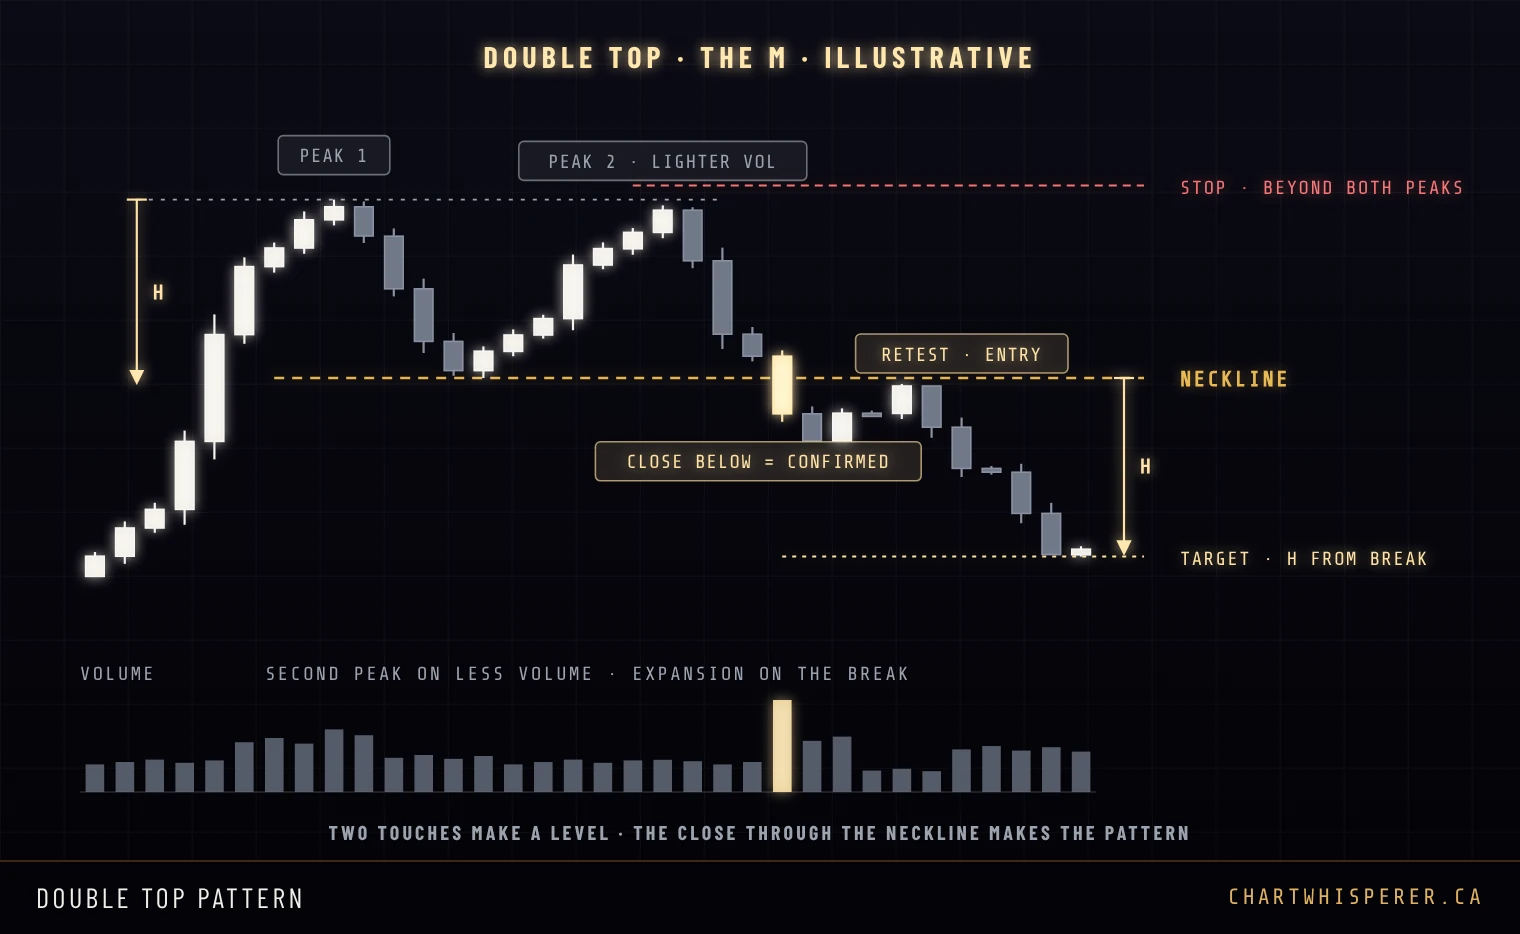
The neckline is the low between the two peaks, not the peaks themselves. Two touches only make a level. The pattern exists when a candle closes below that middle low. The stop goes above both peaks, and the target is the peak-to-neckline height, measured down from the break. Watch the second peak's volume. Lighter than the first is the normal read. Heavier, with a close above the first peak, and the double top has already failed.
The double bottom
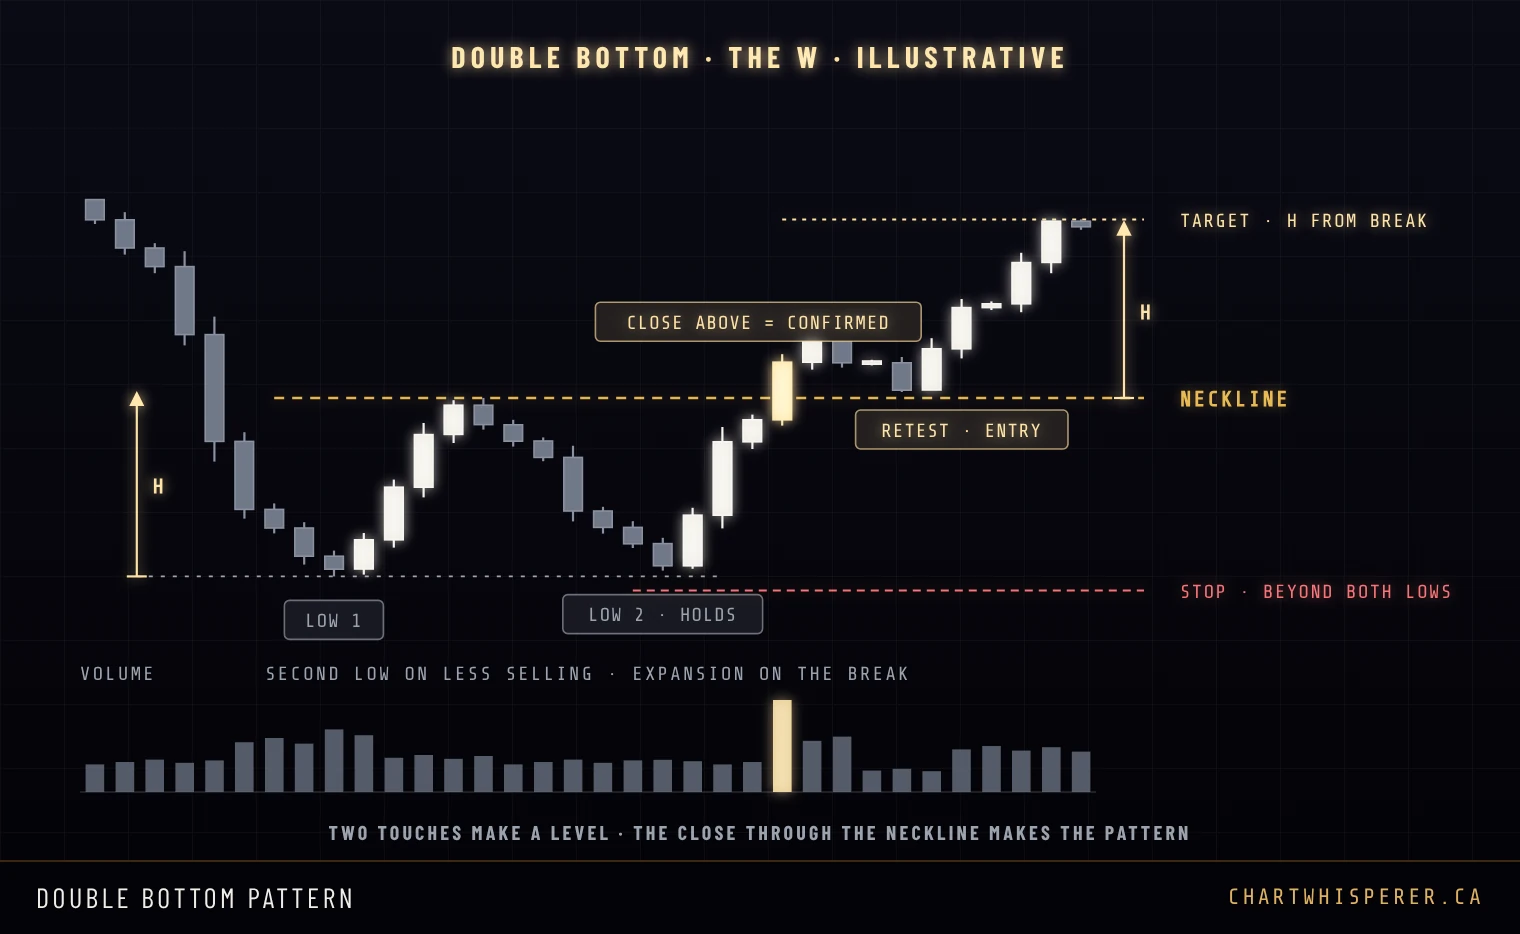
The double bottom is the W: two lows at the same price after a decline, a rally high between them as the neckline, and a close above that high to confirm it. The stop goes below both lows and the target is the depth projected up from the break.
One thing most textbooks leave out. Two equal lows are an invitation. Every stop under the pattern sits in the same place, and the market often takes them before it turns. A third, slightly lower poke under the lows that closes straight back inside is not the double bottom breaking. It is often the liquidity sweep that finishes it.
Triangles: Ascending, Descending and Symmetrical
A triangle is price being squeezed. Every swing is smaller than the one before it, until one side gives up.
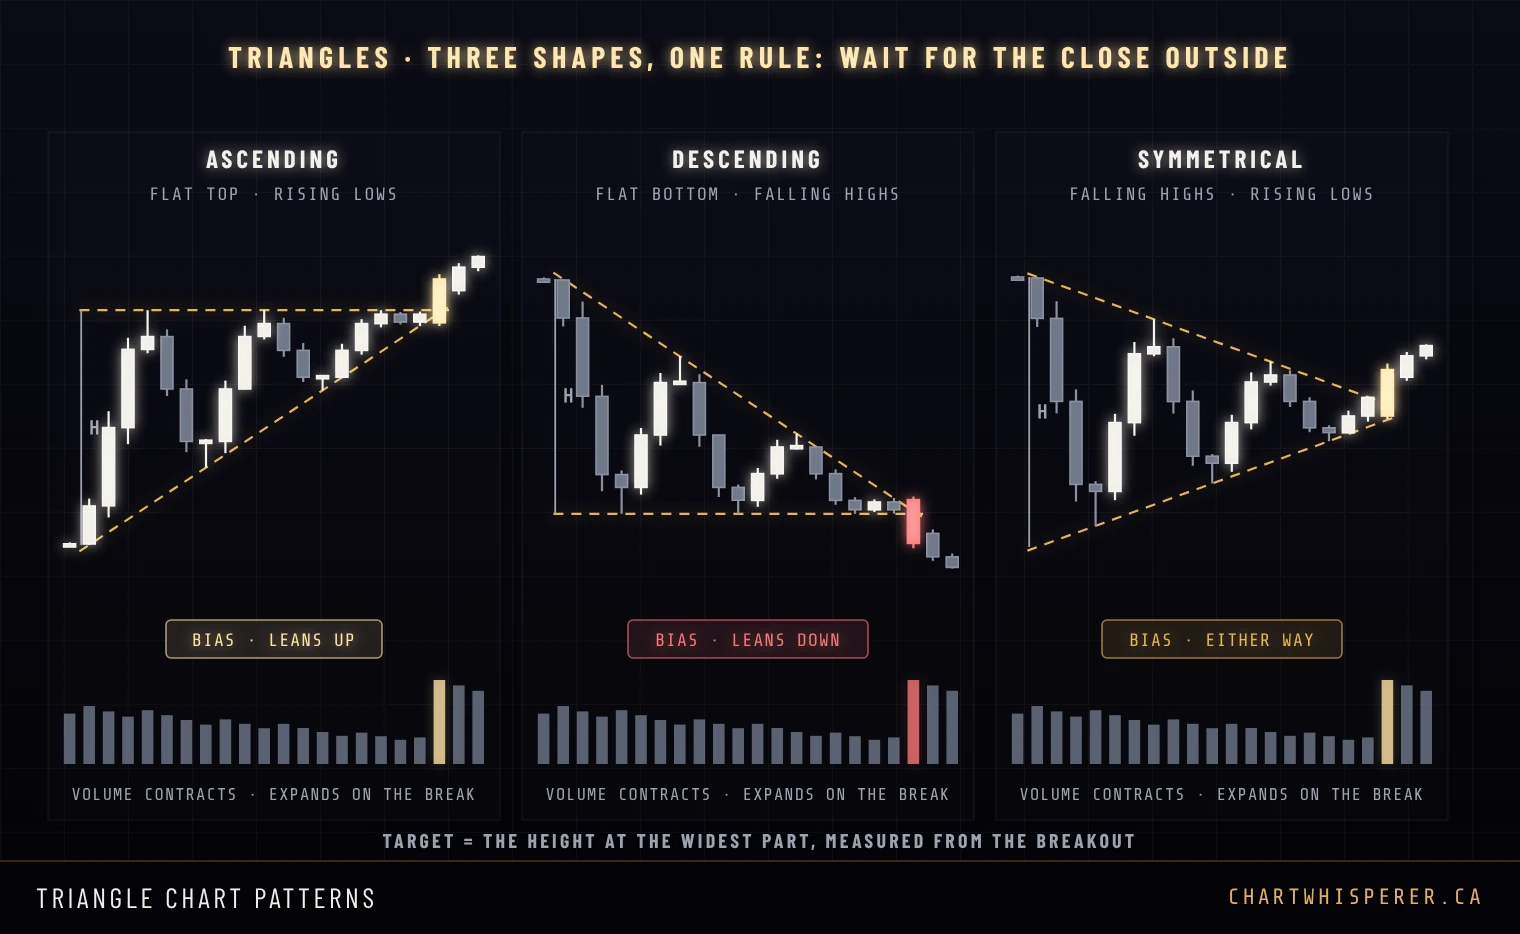
Ascending triangle. The top is flat and the lows keep rising. Sellers defend one price while buyers keep paying more to get in underneath it. It leans toward a break up, but it can break down, so trade the close and not the lean. Confirmation is a close above the flat top, with the stop below the last rising low.
Descending triangle. The mirror image: a flat bottom and falling highs. Buyers defend one price while sellers keep accepting less. It leans toward a break down. Confirmation is a close below the flat bottom, with the stop above the last falling high.
Symmetrical triangle. Both sides are closing in, falling highs and rising lows, and there is no lean at all until it breaks. It is usually read as a pause in whatever trend built it, but the close outside the line decides, not the trend.
The target for all three is the height of the triangle at its widest part, measured from the breakout. Volume should shrink as the triangle narrows and expand on the break. A break that comes late, right at the point of the triangle, on no volume, is the weakest version of the pattern.
Bull Flag, Bear Flag and the Pennant
A big fast move, then a small slow drift against it. The fast move is the pole. The drift is the flag. It is one of the easiest shapes on any chart to spot, which is exactly why it gets overtraded.
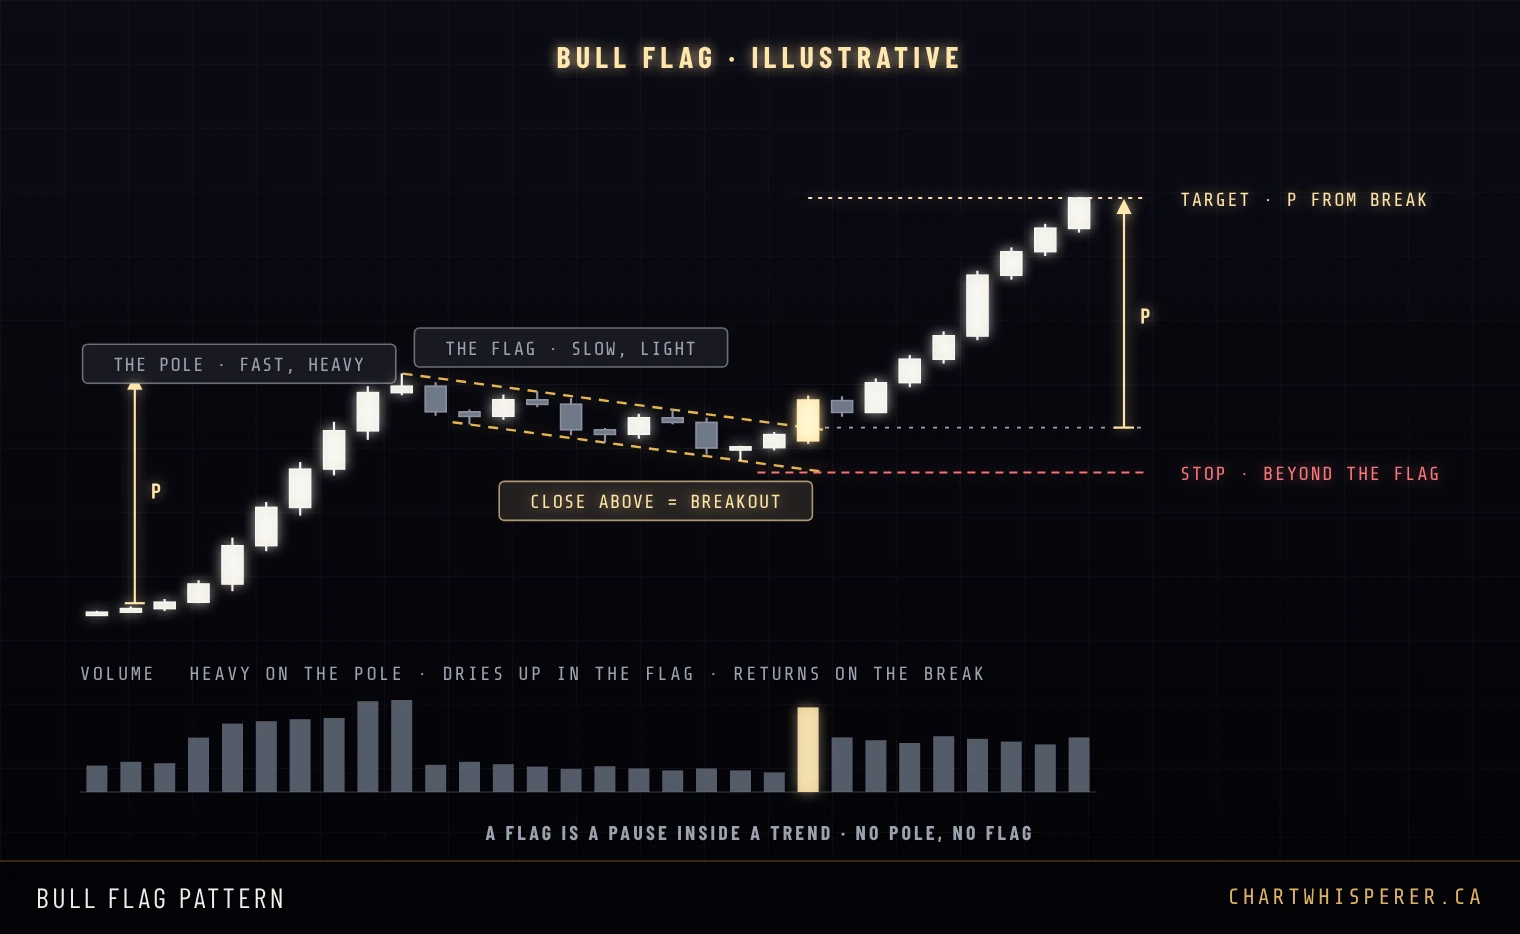
The flag is a pause, not a reversal. Price drifts down inside two parallel lines on much lighter volume than the pole. The break is a candle closing above the upper flag line. The stop goes below the flag low, and the target is the length of the pole added to the breakout point. Two things turn a bull flag into something else: a drift that gives back most of the pole, and a flag that takes far longer to build than the pole did. Neither is a pause any more.
The bear flag
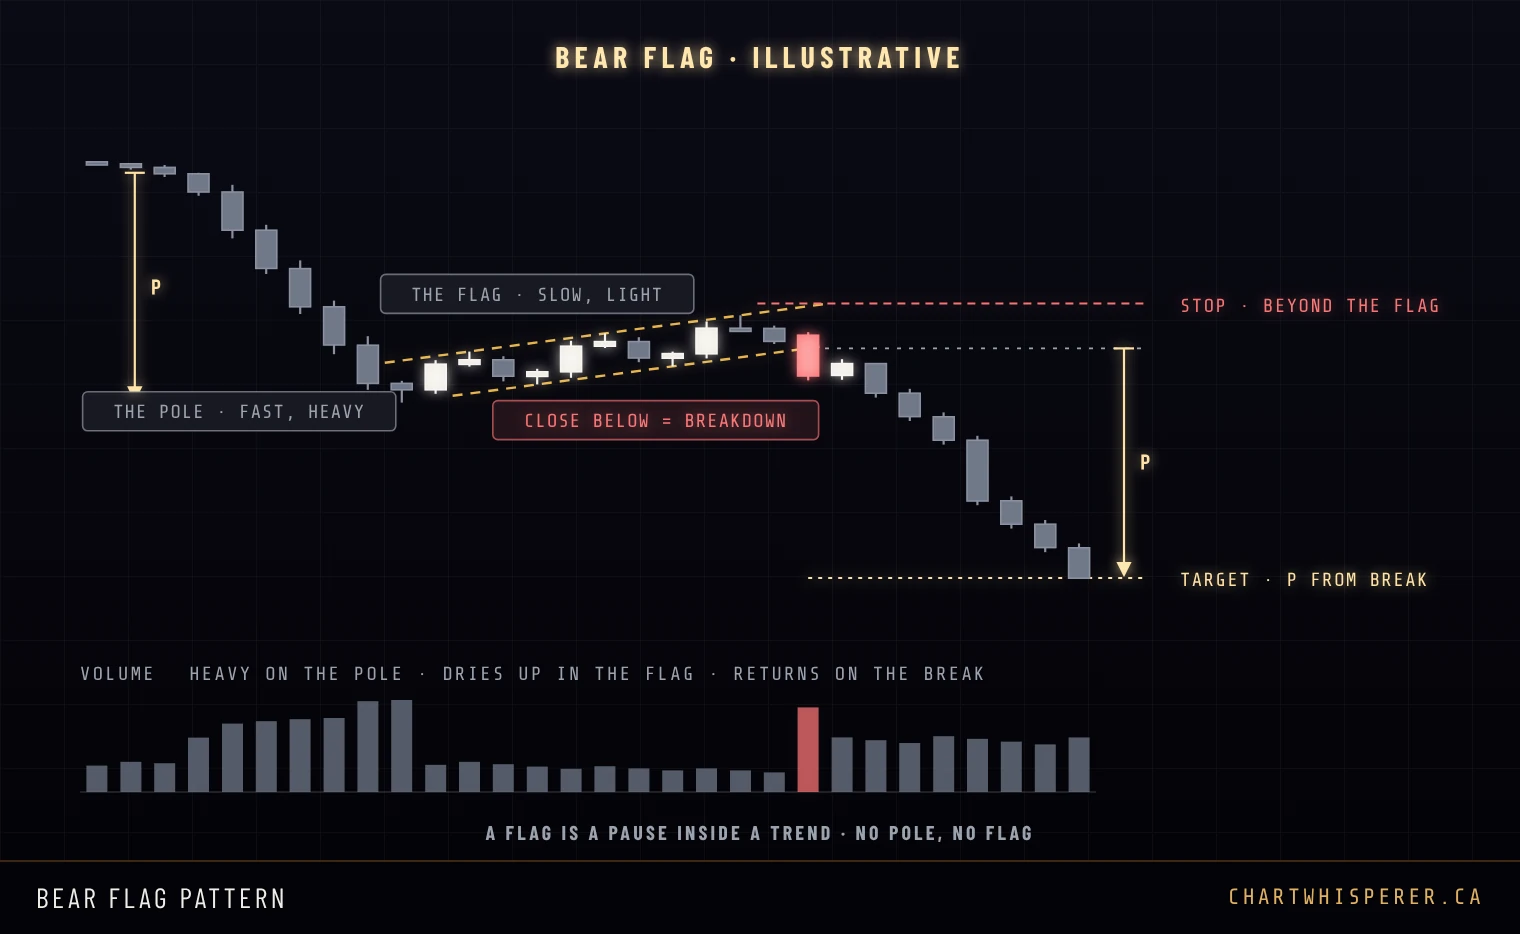
The bear flag is the same thing upside down: a sharp drop on heavy volume, a slow bounce inside a rising channel on light volume, and a close below the lower flag line. The stop goes above the flag high, and the target is the pole's length subtracted from the breakdown point.
The pennant
A pennant is a flag whose pause is a small symmetrical triangle instead of a parallel channel. Pole, pause, a close through the edge, the pole's length as the target. It is the same trade.
Rising Wedge and Falling Wedge
A rising wedge still makes higher highs. Each one just gains less than the one before, and the lows are catching up faster than the highs. The trend is still going up. It is running out of buyers.
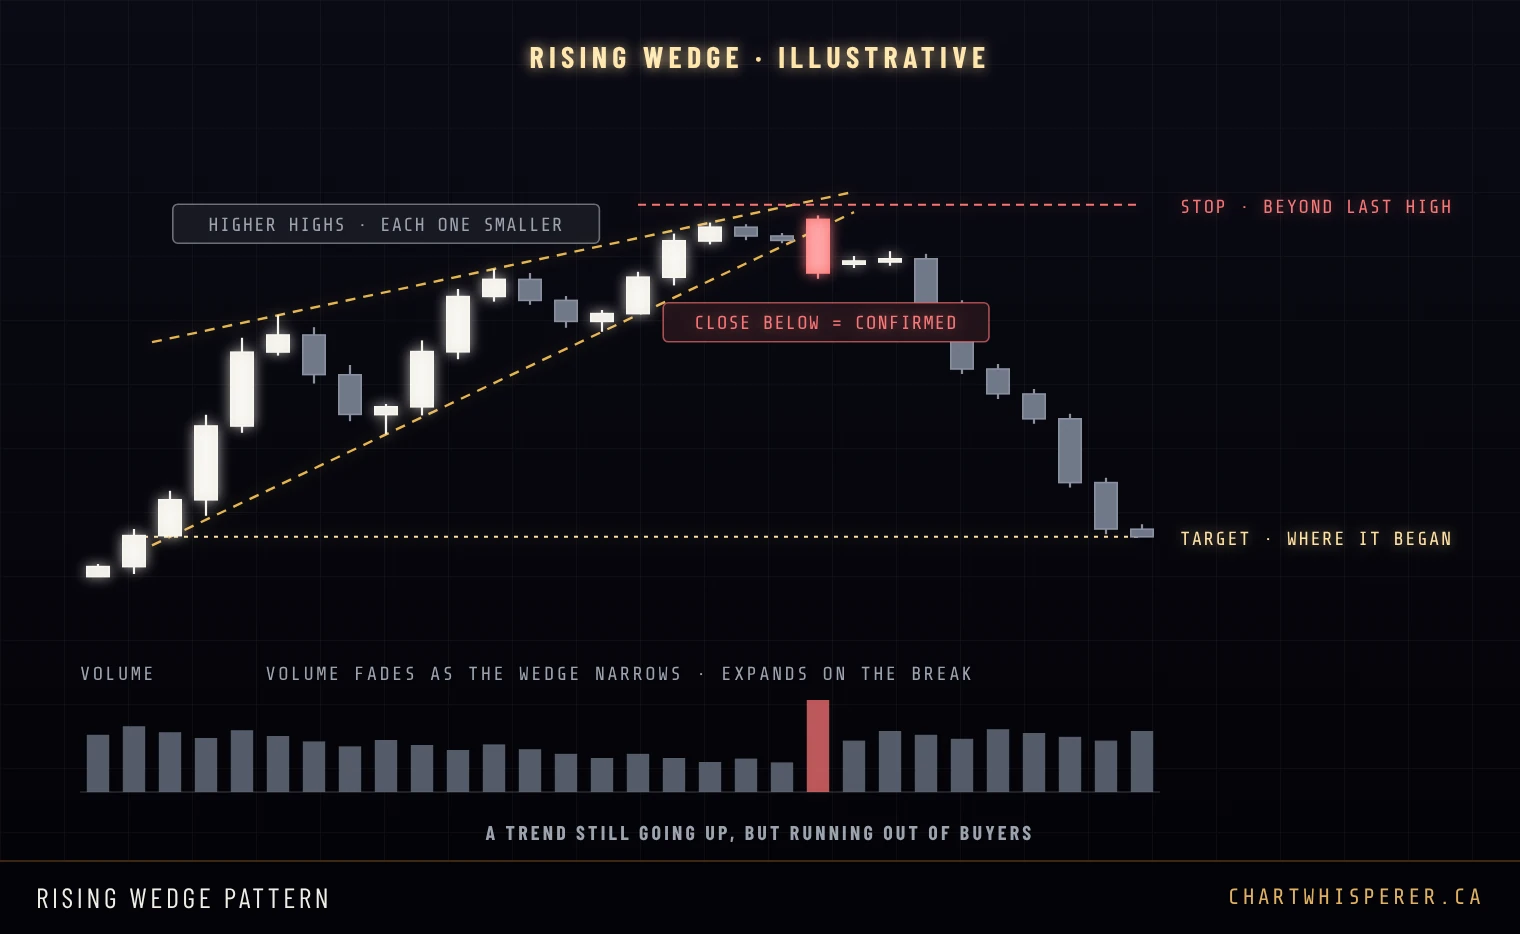
Both lines rise, and they converge because the lower one is steeper. Volume fades as the wedge narrows. The break is a close below the lower line. The stop goes above the last high inside the wedge, and the classic target is the level where the wedge began, which is why a wedge break often moves faster than the slow climb that built it. If you count waves, a rising wedge at the end of a move is the shape of an Elliott Wave ending diagonal.
The falling wedge
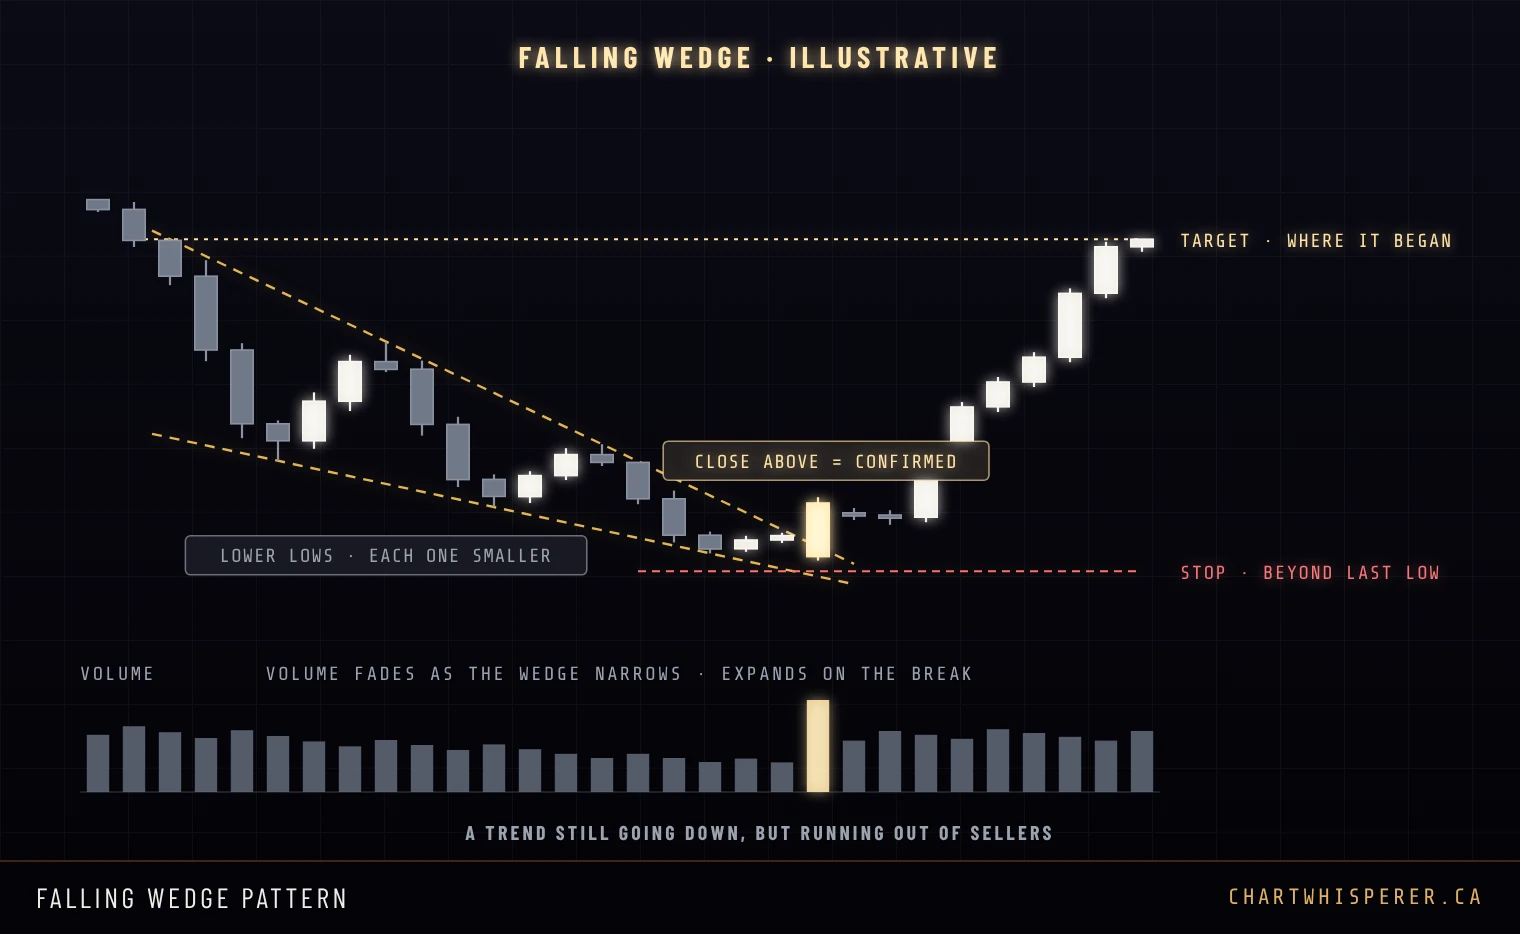
The falling wedge is the mirror: lower highs and lower lows inside two falling lines that converge because the upper one is steeper. Each push down gains less. A close above the upper line confirms the break, the stop goes below the last low inside the wedge, and the target is the level where the wedge began.
Cup and Handle
Price falls, rounds out slowly and climbs back to where it started. That is the cup. Then it dips a little one last time before it breaks. That is the handle.
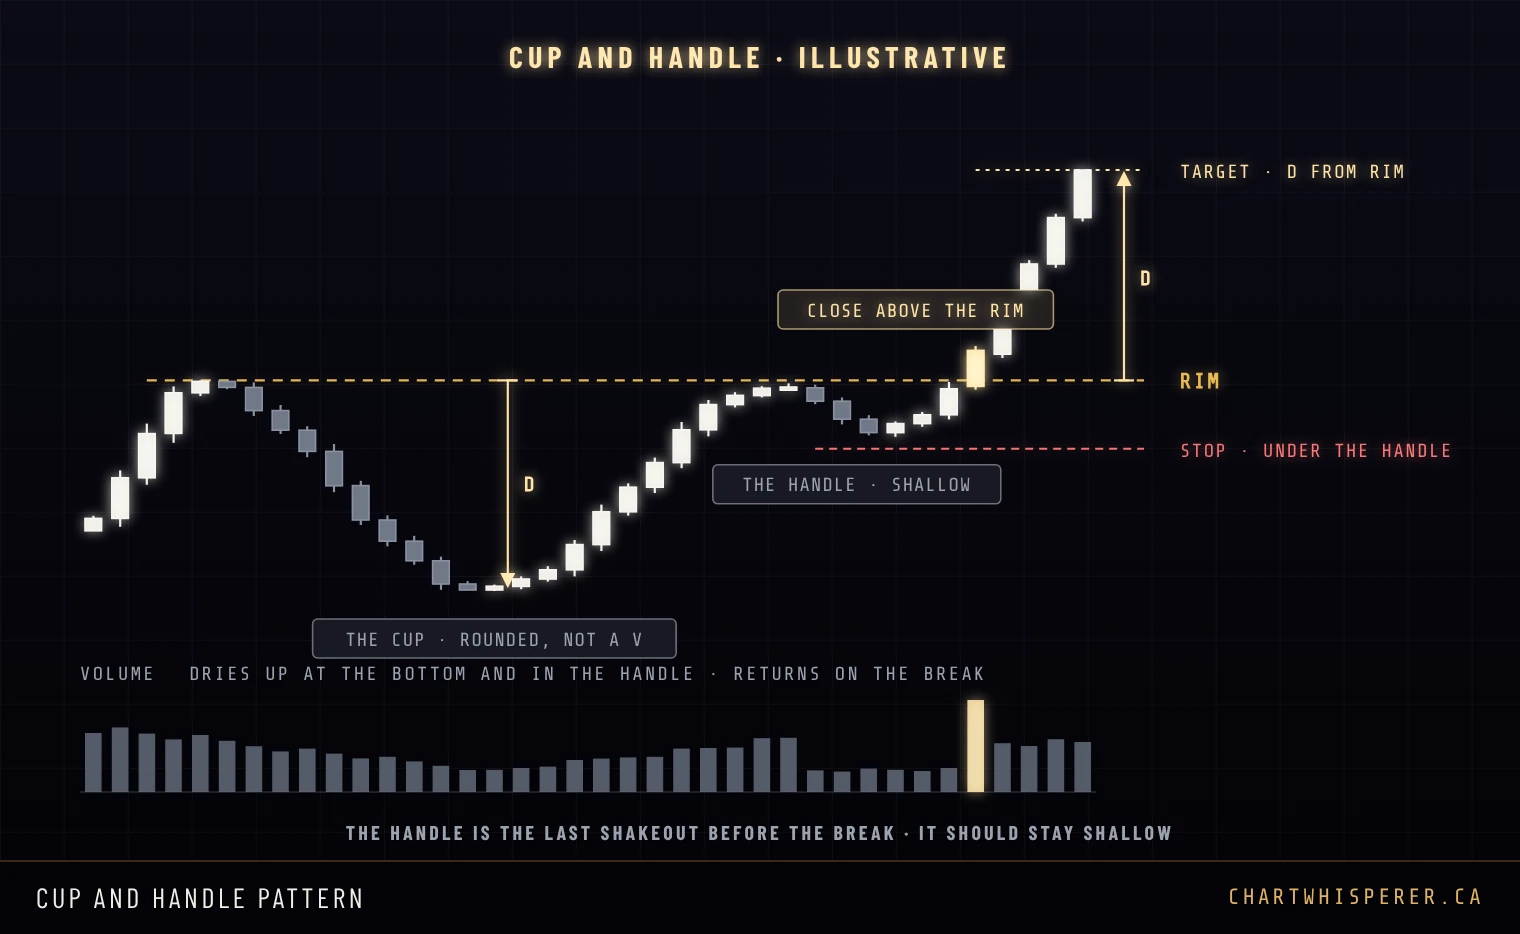
The cup should be a rounded U, not a sharp V. A V is a reversal, not a base. The two rims sit at about the same level, and the line across them is the one that matters. The handle is a short, shallow pullback in the upper part of the cup on light volume, the last shakeout before the break. If the handle gives back more than about a third of the cup's depth, the structure is weakening. The breakout is a close above the rim. The stop goes under the handle low, and the target is the cup's depth added to the rim.
When a Pattern Fails
Every pattern on this page fails some of the time. The failure is not random. It has a shape too, and it is one of the most useful things you will ever see on a chart.
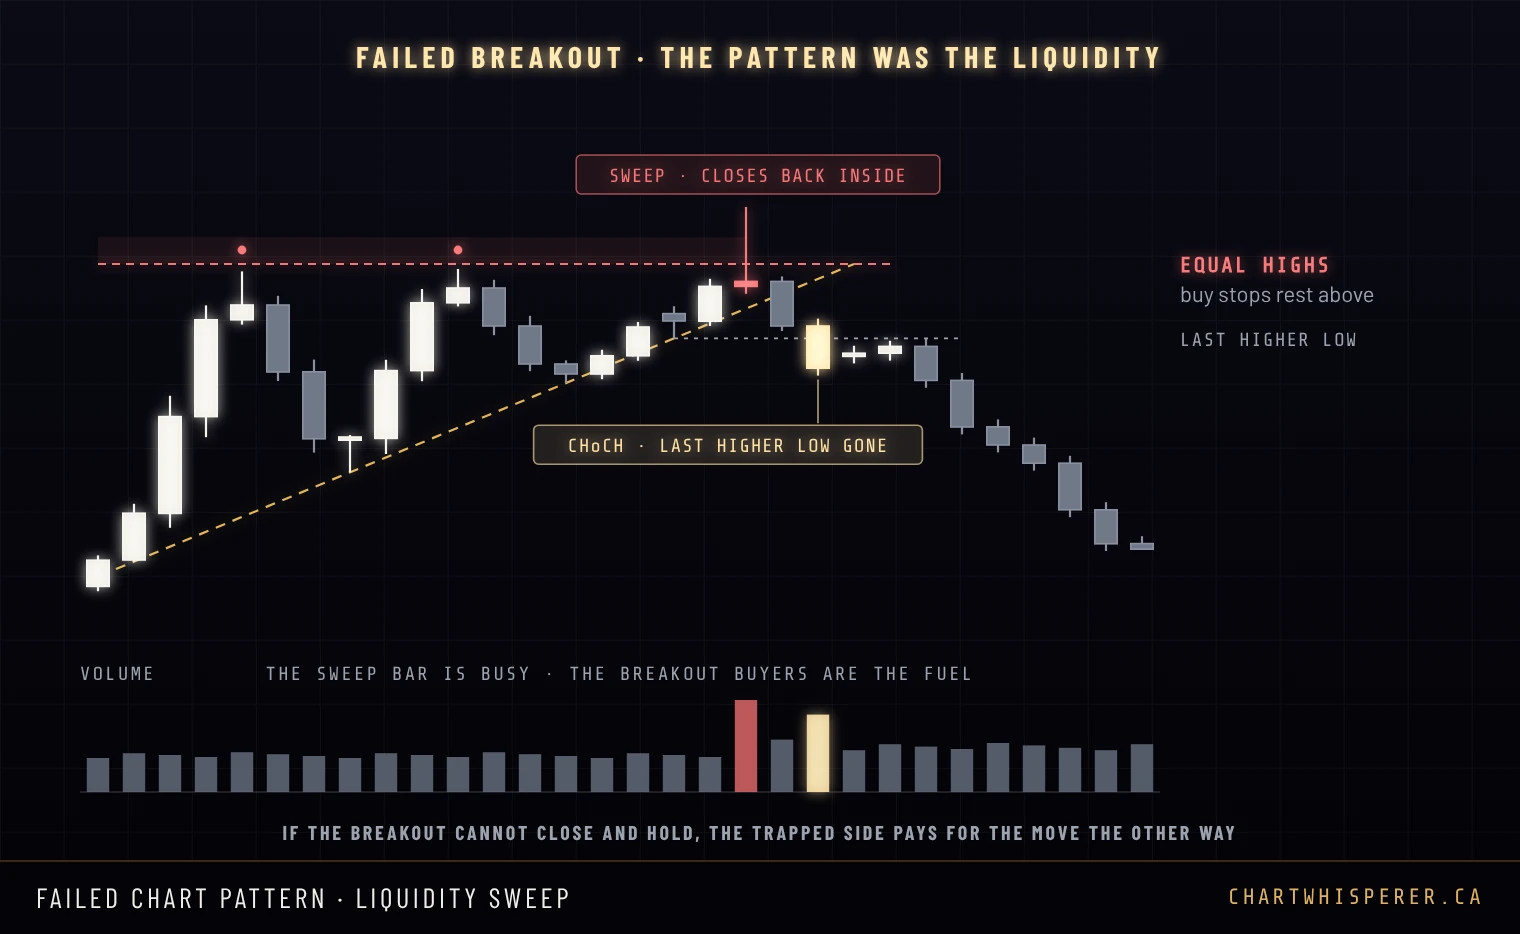
Look at what sits above a flat-topped triangle or a double top: every short seller's stop and every breakout trader's buy order, all at one obvious price. That pool of orders is liquidity. When one candle trades through it, fills those orders and then closes back inside the pattern, the breakout was a sweep. The traders who bought the break are now trapped above a level that just rejected them, and their stops are the fuel for the move the other way.
The confirmation is the same as everywhere else on this page, a close. Here it is a close below the last higher low, which is a change of character. This is why the close rule is not pedantry. A wick through the line is exactly what a failed pattern looks like in its first minute.
Are Chart Patterns Reliable?
Upfront, so nobody has to work it out: the CAP backtest does not test chart patterns as signals on their own, so this guide gives you no win rate for them, and I am not going to invent one. You will find plenty of numbers elsewhere. Before you trust one, read how the study defined a win.
The best-known figures come from Thomas Bulkowski's work on chart patterns. In his rankings a pattern only counts as a failure if price cannot move more than 5% past the breakout before it turns. That is a fair way to rank shapes against each other. It is not a trade. A pattern can succeed by that definition and still hit your stop. Bulkowski makes the same point himself: the failure rate climbs quickly once you ask for a move big enough to be worth trading.
What separates the patterns that work from the ones that do not is context. Where the pattern sits in the trend, whether the break closes, and what volume does underneath it. That is a reading skill, and it is learned on charts, not from a table. Reading the Tape is the free drill for the volume half of it.
How I Use Patterns Inside the CAP
Chart patterns are not rules in the CAP, and I do not take a trade because a shape appeared. I use them as maps. A pattern tells you where the stops are sitting, above the shoulders, under the double bottom, over the flat top of a triangle, and where structure will break if it is going to.
Inside the CAP that maps straight onto the gates. The close through the neckline is the Gate 2 break of structure. The retest of the neckline is where the pullback entry is worked, in the OTE zone, and Gates 3 to 5 do their work there. A pattern that sweeps its own liquidity and closes back inside is a setup in the other direction. The gates decide whether there is a trade. The pattern only tells you where to look.
Frequently Asked Questions
What are the most common chart patterns?
The twelve classic chart patterns are the head and shoulders, the inverse head and shoulders, the double top, the double bottom, the ascending, descending and symmetrical triangles, the bull flag, the bear flag, the rising wedge, the falling wedge and the cup and handle. The pennant is a close cousin of the flag. Every one of them is confirmed the same way: a candle body closing through the pattern's line.
Which chart patterns are bullish and which are bearish?
Bullish: the inverse head and shoulders, the double bottom, the falling wedge, the bull flag and the cup and handle, with the ascending triangle leaning bullish. Bearish: the head and shoulders, the double top, the rising wedge and the bear flag, with the descending triangle leaning bearish. The symmetrical triangle has no lean until it breaks. A lean is not a signal: the close through the line decides.
How do you calculate a chart pattern's price target?
Measure the pattern's own height and project it from the breakout. For a head and shoulders it is the distance from the head to the neckline. For a double top or bottom it is the distance from the peaks or lows to the neckline. For a triangle it is the height at the widest part, for a flag the length of the pole, and for a cup and handle the depth of the cup. A wedge's classic target is the level where the wedge began. A target is where to look for profit, not a price the market owes you.
Where do you put the stop loss on a chart pattern?
On the far side of the structure that built the pattern, where the pattern would be proven wrong: above the right shoulder of a head and shoulders, above both peaks of a double top, below the flag low of a bull flag, below the handle of a cup and handle. If you enter on the retest of the broken line instead of the first break, the stop can sit just beyond the retest, which is usually much closer.
Are chart patterns reliable?
They are maps, not guarantees. The best-known statistics, from Thomas Bulkowski, count a pattern as a failure only if price cannot move more than 5% past the breakout, which is a way to rank shapes, not a trading result. A pattern can pass that test and still hit a stop. What decides whether one works is context: where it sits in the trend, whether the break closes rather than wicks, and what volume does. The Chart Whisperer publishes no stand-alone win rate for chart patterns because the CAP backtest does not test them on their own.
What is the difference between a bull flag and a pennant?
Both start with a pole, a sharp move on heavy volume, and both are pauses inside the trend. In a flag the pause drifts against the trend inside two parallel lines. In a pennant the pause is a small symmetrical triangle. They are traded the same way: a close through the edge of the pause, a stop beyond it, and the pole's length as the target.
Is a head and shoulders pattern bullish or bearish?
A head and shoulders top, formed after an uptrend, is bearish and is confirmed by a close below the neckline. The inverse head and shoulders, formed after a downtrend, is bullish and is confirmed by a close above the neckline. A head and shoulders that breaks its neckline and then closes back above it has failed, and the trapped sellers often fuel a move higher.
Do chart patterns work on crypto?
The shapes appear on crypto charts the same way they do on stocks, forex and futures, on every timeframe. Crypto trades around the clock with thinner order books on weekends, so wicks through pattern lines are common. That makes the close rule more important on crypto, not less: wait for a candle body to close through the line, and treat a wick that closes back inside as a possible sweep.
Get the Free CAP Framework Course
Six days. Wyckoff, Elliott Wave, CVD, the 5-gate protocol, risk sizing and execution psychology — the complete foundation behind every setup on this site, delivered one lesson a day to your inbox. Plus the 8-Point Setup Gate Checklist on Day 1.
The pattern is the map. The CAP is the order.
The CAP Framework puts the regime, the break, the CAP zone, the confluence grade, and the trigger in one fixed order, backtested on BTC, ETH, SOL and LINK. A pattern tells you where the stops sit and where structure will break. The gates decide whether there is a trade.
Explore the CAP Framework →Not ready to commit? Start with the free 8-Point Checklist →
Ready to go deeper? See the 90-Day Mentorship →