Volume Profile: Where the Market Agreed on Price, and How to Read It
A candle chart tells you when price was somewhere. A volume profile tells you where the business got done. That difference decides where price tends to slow down, and where it tends to fly.
Volume profile is a sideways bar chart drawn against price instead of time. Each bar shows how much was traded at that price over a stretch of chart you choose. The longest bar is the point of control (POC), the single busiest price. The value area is the band around it that holds 70% of the volume, and its top and bottom are the value area high (VAH) and value area low (VAL). Thick rows are prices the market accepted, where price tends to slow down. Thin rows are prices it rejected, which price tends to cross fast. The setting that matters most for a beginner is not a number. It is anchoring the profile to a fixed range you chose, so the levels stay where they are while you read them.
What Volume Profile Is, in Plain Words
Every normal chart puts time along the bottom. It shows you when price was somewhere. It does not show you how much business got done there. Turn the chart on its side, add up the volume traded at each price, and a different picture appears: some prices were crossed in seconds and almost nobody traded them, and others traded for hours because both sides agreed they were fair.
That sideways picture is the volume profile. It comes from auction market theory, which grew out of J. Peter Steidlmayer's Market Profile work at the Chicago Board of Trade in the 1980s. The idea underneath it is simple. A market is an auction looking for the price where the most business can be done. When it finds one, volume piles up there. When price moves away and nobody wants to trade, volume stays thin.
Five words cover almost everything you will read about it:
- POC (point of control): the price row with the most volume in the range you measured.
- Value area: the band around the POC holding 70% of the volume.
- VAH and VAL: the value area high and value area low, the top and bottom edges of that band.
- HVN (high-volume node): a thick part of the profile, where the market accepted price and tends to slow down.
- LVN (low-volume node): a thin part, where the market rejected price and tends to move through quickly.
The profile does not predict anything. It is a record of where agreement happened. That is exactly why it is useful: support and resistance drawn from where people actually traded is harder to argue with than a line drawn through two wicks. The order flow guide covers the common profile shapes (P, b, D and double distribution) with computed diagrams, so this guide spends its time on the parts that decide whether you read a profile well or badly: how it is calculated, which version to put on your chart, and how to read it on a real crypto chart.
How the POC and Value Area Are Calculated
The profile splits the price range you selected into rows, for example 100 dollars each. Every candle's volume is then shared out across the rows it traded through and added up. The row with the biggest total is the POC.
TradingView does this more precisely than one candle at a time. Its documentation says the profile reads lower-timeframe data underneath your chart: it checks the 1, 5, 15, 30, 60 and 240-minute and daily intervals in turn and uses the first one that covers your range in fewer than 5,000 bars. On a lower-timeframe bar, a close above the open counts as up volume and anything else counts as down volume. So a 4-hour chart's profile is usually built from much finer bars than the ones you are looking at.
The value area is built outward from the POC, one row at a time:
- Start with the POC row.
- Compare the next row above with the next row below.
- Add whichever of the two traded more.
- Repeat until 70% of all the volume in the profile is inside.
- The highest row added is the VAH. The lowest is the VAL.
The 70% figure is a convention, not a law. It comes from Market Profile, where 70% was taken as roughly one standard deviation of a normal distribution either side of the centre. TradingView sets it to 70% by default and lets you change it. Leave it there. Everyone else is looking at 70%, and a level matters partly because other people are watching it.
The other setting that changes the picture is the row size. Rows that are too big blur the profile into a few blocks. Rows that are too small turn it into noise. On TradingView you can set it as a number of rows or as ticks per row. Pick one that shows clear thick and thin areas on the range you are studying, then leave it alone, so today's profile can be compared with yesterday's.
Visible, Fixed or Session: Which Profile to Use
TradingView ships six built-in profile tools: Visible Range, Fixed Range, Session, Session HD, Periodic and Auto Anchored. They all draw the same thing. The only difference is which stretch of chart they measure, and that difference is the whole game.
- Visible Range measures whatever is on your screen right now. Zoom out, scroll left, or switch timeframe, and it recalculates.
- Fixed Range measures exactly the stretch between two points you click. It stays there until you move it.
- Session and Periodic draw one profile per day, week or other period, which is how futures traders map each session.
- Auto Anchored anchors itself from a rule you pick, such as the start of the session or the week.
The visible-range profile is the one most people meet first, because it is one click away. It is also the one that quietly makes a new trader's life harder. Its POC is a property of your screen, not of the market. Move the screen and the level moves, and you are now planning a trade around a line that was somewhere else five minutes ago.
Charles puts it bluntly in class. Asked about it in the free Sunday class on springs, he said this:
“There’s two different tools for the volume. So one is … it moves as you move, and that is a very difficult thing to do, especially as a new person. You don’t recognize what you’re doing. So I’d recommend actually not using this ever until you’re, you know, a year in or something. … Use instead the fixed one. … and that thing then should remain fixed across the two hour down to the 15 minute. The line doesn’t change. That way you can have an actual control, rather than just some moving line that’s always changing.”
That is the rule this site teaches. Use a fixed range. Anchor it to something the market actually did, and keep the same profile as you drop from the higher timeframe to the one you execute on. Watch that part of the class (from 50:38) for the full answer.
How to Anchor a Fixed Range Profile, Step by Step
A fixed range profile is only as good as the range you give it. The point is to measure one piece of market behaviour, start to finish, and nothing else.
- Find the range first, without the profile. Mark the range high and range low on the timeframe where the range is obvious. In Wyckoff terms that is usually the selling climax and the automatic rally that follows it, or their mirror images at a top.
- Anchor the first click where the range began. On TradingView the Fixed Range Volume Profile is in the drawing tools. Click once on the bar that started the range, such as the selling climax.
- Anchor the second click on the latest bar of the range, or tick “Extend right” so the profile keeps building as new bars print inside it.
- Read four lines: the range high, the range low, the midline between them, and the POC. Then the value area edges.
- Check it on a slower chart. If the structure is messy on the 1-day, look at the 2-day or 3-day. In class Charles redraws the same range on a 3-day because the levels are clearer there.
- Carry it down unchanged. Drop to the 2-hour, the 1-hour and the 15-minute with the same profile. The lines must not move. That is the control.
If you cannot say in one sentence what the range is, there is no range to profile. A profile drawn across two different behaviours, half of a downtrend and half of a base, averages them into a level that belongs to neither.
Reading It: Acceptance, Rejection and the POC as a Wall
A profile marks where to look. What happens when price gets there is a separate question, and the tape answers it.
At the edge of value. Inside the value area the market is in balance and the edges tend to get faded. When price leaves value, the break itself is not the signal. The retest is. If price comes back to the VAH from above, holds, and volume starts building up there, value has moved with price. If it pokes outside and falls straight back in, nobody would do business up there, and price often rotates back through the POC toward the far edge. The order flow guide draws both cases.
In a thin area. A low-volume node is an air pocket. Price that enters one tends to travel through it to the next thick area. That makes an LVN a poor place to wait for a bounce and a natural place to expect speed.
At the POC. The POC is a magnet more often than it is a wall, because both sides already agreed it was fair once. When it does act as a wall, you see it on the bars, not on the profile: effort into the level that gets no result beyond it.
That last picture is the read Charles teaches in the free group classes. A bar sweeps into the POC with far more volume and spread than the bars before it, punches the wall, and cannot close below it. The next bar closes up with control. The profile told you where to look. The tape told you what happened there.
A live example, 4 November 2026
This is the same read on a real chart, published by Charles on TradingView the day this guide went up. On the ETHUSDT 2-hour chart, the pullback ran below the low of the a leg to about 2,226, taking the stops under it, and then recovered above the POC near 2,250 (the yellow line) and above monthly support at 2,257.79. The profile on the left is what makes that low readable. Without the POC on the chart, the bounce is just another candle.
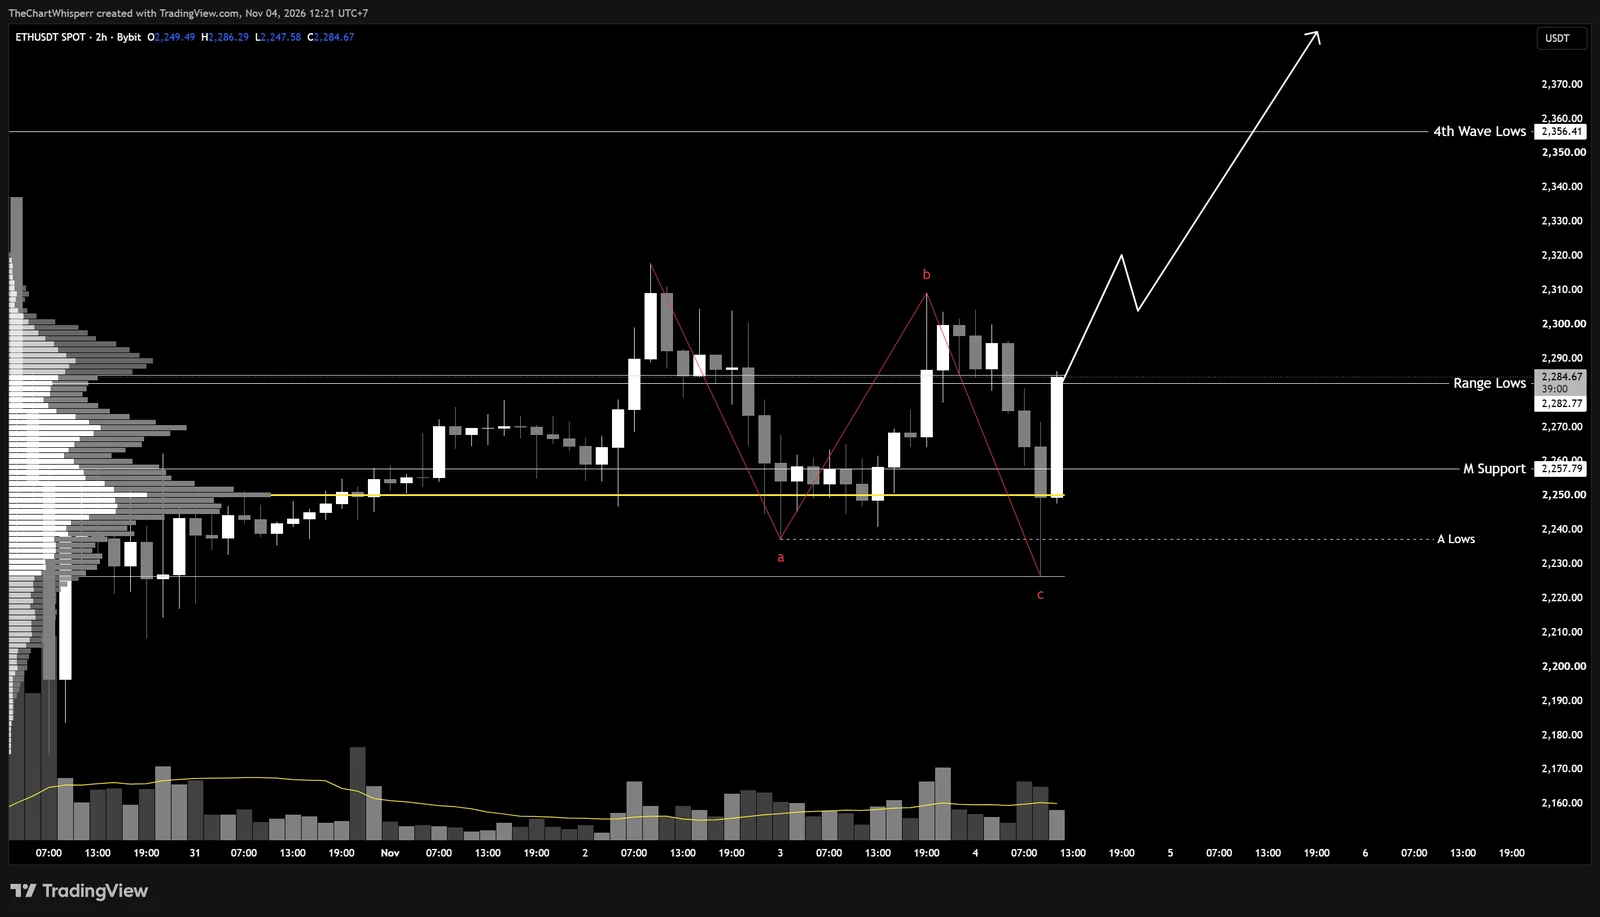
The rules were written before the next bar, in if-then form. A 15-minute or 1-hour close back above the sweep candle’s high is the entry signal. A break below the 30 October low voids the setup. If it confirms, the first area he is looking at is the 4th wave lows at 2,356.41. That is his analysis at the time, not financial advice, and it is here to show the method, not the outcome: the level was on the chart before the test, and the bars at the level decide what it is worth.
What Changes in Crypto
Volume profile came from futures pits with an opening bell and a closing bell. Crypto has neither, and three things follow from that.
There is no natural session. A session or periodic profile in crypto starts at a clock time, usually midnight UTC or your chart's time zone, and that cut is arbitrary. Nobody's day starts at 00:00 UTC. That is one more reason to anchor profiles to structure, such as a range or a swing, instead of to the calendar.
Your profile only shows your exchange. A profile on a Binance perpetual chart counts Binance perpetual volume and nothing else. The same coin on Coinbase spot, or another exchange's perpetual, traded different amounts at different prices and can put its POC somewhere else. Pick one source for each coin and stay with it, so the levels you mark this week can be compared with last week's.
Perpetual volume includes leverage. A big node on a perpetual chart can be built by positions that will be forced out later, which is not the same kind of agreement as spot buyers taking coins off an exchange. When a level matters, check whether the volume behind it was spot-led or perp-led. The order flow guide explains how, and the CVD guide shows what the aggressive side was doing at the same time.
On plans: TradingView lists volume profile among the features of its paid plans, from Essential upward, and does not break availability down tool by tool. Check the indicator search on your own account before you build a routine around one of them.
Volume Profile Inside a Wyckoff Range
Volume profile and Wyckoff describe the same thing from two angles. A Wyckoff accumulation is a range where larger players buy without moving price much. A fixed range profile of that range shows where they did it.
- The POC forms inside the range, usually somewhere between the selling climax and the automatic rally, where the market spent most of its time.
- A spring trades below the range low, and often below the value area low as well, on thin profile rows. A spring that closes back inside, followed by a test on lower volume, is the classic entry area.
- The sign of strength leaves value and has to hold above the VAH on the retest. A range with thin rows above it can travel fast once that happens, because there was little trading up there to slow it down.
The Wyckoff accumulation guide walks the phases in order, and the Wyckoff method page covers the full rulebook. Use the profile to see the range. Use Wyckoff to know what each part of the range is for.
Learn the Whole Framework Free
Six days, one lesson a day: Wyckoff structure, Elliott Wave, CVD order flow, the 5-gate protocol, position sizing and execution psychology. The 8-Point Setup Gate Checklist arrives on day one.
Five Volume Profile Mistakes
Reading a profile that moves while you read it
A visible-range profile recalculates every time you zoom or scroll. Its POC is a property of your screen. Use a fixed range until you know exactly what the moving version is measuring, and why.
Profiling a stretch of chart with no structure in it
A profile drawn across half a trend and half a base averages two different behaviours into one level. Anchor to a range or a swing you can name, start to finish.
Treating the POC as a wall every time
The POC attracts price more often than it stops it. A level is only a wall when the bars at it show effort with no result. Until then it is a place to watch, not a place to buy.
Comparing profiles from different exchanges
A POC on one venue's perpetual and a POC on another venue's spot chart are two different measurements. Choose one source per coin and keep it.
Waiting for a bounce in a low-volume node
Thin rows are where price moves fast, not where it stops. If your entry sits in the middle of an LVN, the profile is telling you the market has no reason to pause there.
Where Volume Profile Sits in the CAP
In the Continuation Acceleration Protocol a volume level is context, not an entry. Profile levels are mapped before the session, as context for the regime read. A CAP zone that sits on the value area high of the prior range, or on a high-volume node, is a zone with a reason for somebody to be there. A zone floating over a low-volume node is one price will likely cross in a hurry. The profile also tells you where the sweep-and-absorption evidence the protocol asks for would carry the most weight.
One thing it does not do is carry a win rate of its own. The published backtest on Protocol Results measures the whole protocol, every gate in order, not a volume level on its own, so no figure is quoted for profile levels here. Anyone selling you a win rate for “buying the POC” should be able to show you the table it came from.
Frequently Asked Questions
What is volume profile in trading?
Volume profile is a sideways histogram that shows how much was traded at each price over a range of the chart you choose. It shows where the market agreed on price, not just where price went. Its main levels are the point of control (the busiest price), the value area that holds 70% of the volume, and the high- and low-volume nodes that mark where price tends to slow down or move fast.
What is the POC in volume profile?
The POC, or point of control, is the price row with the most traded volume in the range being measured. It is the market's centre of gravity for that range. Price returning to it often slows down or rotates around it, because both sides already agreed it was a fair price once. It acts as a magnet more often than as a wall.
What is the value area, and why 70%?
The value area is the band of prices around the POC that holds 70% of the volume in the profile. Its top is the value area high (VAH) and its bottom is the value area low (VAL). It is built outward from the POC one row at a time, always adding the busier neighbour, until 70% is inside. The 70% comes from Market Profile, where it was taken as roughly one standard deviation, and it is TradingView's default.
Fixed range or visible range volume profile: which is better?
For most traders, and for every beginner, fixed range. A visible range profile measures whatever is on your screen, so its levels move every time you zoom or scroll. A fixed range profile measures the exact stretch you anchor it to, such as a trading range, and its levels stay put as you move from the higher timeframe down to the one you execute on. Charles recommends not using the moving version until you are about a year in.
Is volume profile free on TradingView?
TradingView lists volume profile among the features of its paid plans, starting from the Essential plan, and does not break availability down tool by tool on its pricing page. Check the indicator search on your own account to see which of the six profile tools you can use.
Does volume profile work for crypto?
Yes, with three adjustments. Crypto trades all day every day, so session profiles start at an arbitrary clock time and ranges anchored to structure are more meaningful. Each exchange's chart only counts its own volume, so pick one source per coin and keep it. And perpetual volume includes leveraged positions, so check whether a big node was built by spot buying or by perps.
What is the difference between volume profile and market profile (TPO)?
Volume profile counts how much volume traded at each price. Market Profile, also called TPO for time price opportunity, counts how much time price spent at each price, usually in 30-minute blocks. They often point to the same areas. When they disagree, volume profile tells you where the business was done and TPO tells you where price lingered.
What is a naked POC?
A naked or virgin POC is the point of control of an earlier profile, such as a previous day or range, that price has not traded back to since. Traders mark them as levels price may return to. Treat them as places to watch, not as signals, and read the bars when price gets there.
Get the Free CAP Framework Course
Six days. Wyckoff, Elliott Wave, CVD, the 5-gate protocol, risk sizing and execution psychology — the complete foundation behind every setup on this site, delivered one lesson a day to your inbox. Plus the 8-Point Setup Gate Checklist on Day 1.
The profile is the map. The CAP is the order.
The CAP Framework puts the regime, the break, the CAP zone, the sweep and grade, and the trigger in one fixed order, backtested on BTC, ETH, SOL and LINK. A volume profile shows you where the market agreed on price; the gates decide whether there is a trade.
Explore the CAP Framework →Not ready to commit? Start with the free 8-Point Checklist →
Ready to go deeper? See the 90-Day Mentorship →